Performance Monitoring
Download Now Request a demo

You can monitor any available performance counter on Windows or SNMP counter on Non-Windows devices and either be alerted when a counter exceeds a preset threshold or log counter data in the EventSentry database.
In a nutshell, you can:
- Setup alerts and be notified (e.g. email, pager) when a counter exceeds your limit over a set period of time
- Setup performance groups to be alerted when more than one counter exceeds the threshold
- Record performance data in a database to analyze past performance data and predict future usage
Performance Alerts
Performance Alerts Icon You can setup performance alerts to be notified if a monitored counter exceeds, matches or falls below a set limit. You can configure how often the performance counter should be monitored (e.g. every 30 seconds), and for how long the performance counter has to exceed the limit before an alert is generated. Once an alert is generated, you can be notified through any of the supported notification methods since performance alerts are logged to the event log. For example, you can receive an email when a process on a server uses more than 95% of CPU time for more than 15 minutes.
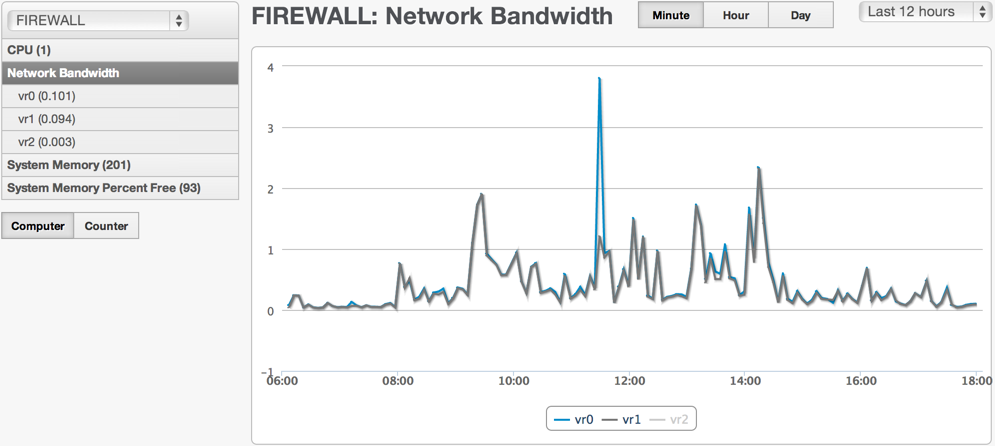
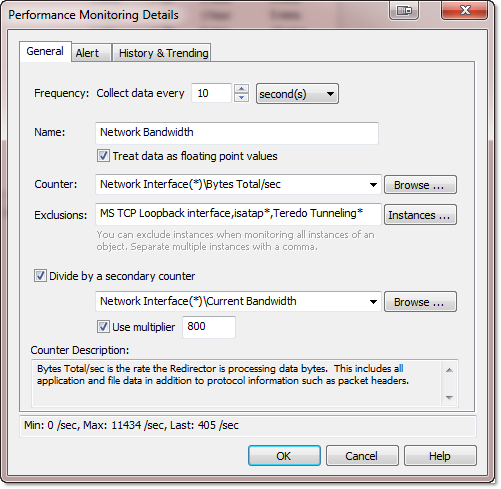
Secondary Counters
A performance counter can be divided by a secondary counter, to calculate dynamic performance values that are otherwise not directly available through existing performance counters. Secondary counters support creating dynamic counters like Memory or Network Utilization (which are otherwise not available) as well dynamic database-related performance counters.
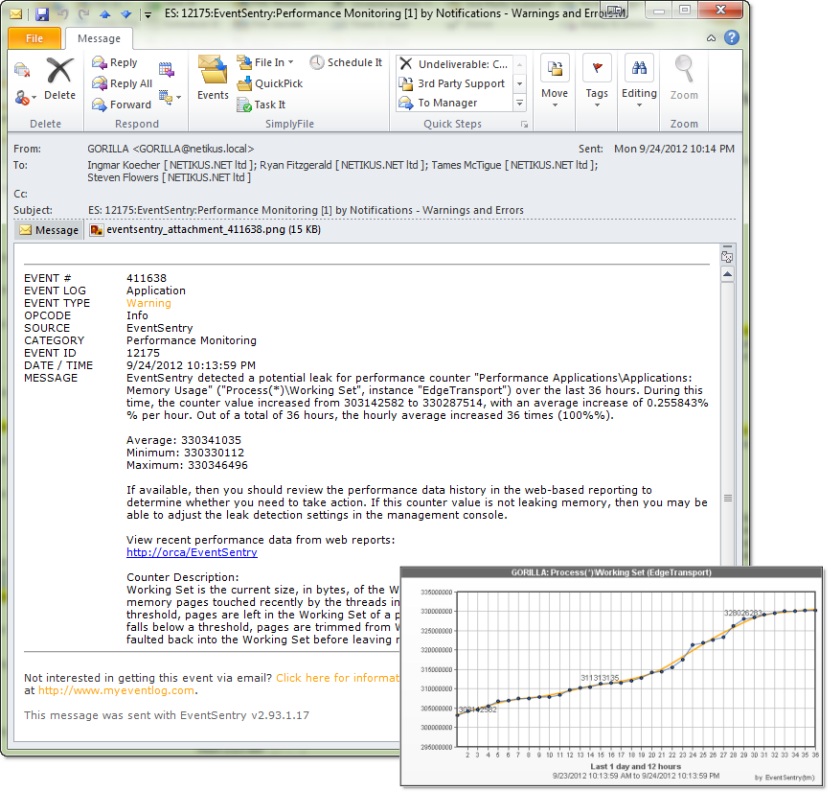
Leak Detection
EventSentry can attempt to detect leaks in performance counters, especially useful for counters that indicate the current memory or handle count usage of a process. This can help detect problems in early stages, before they cause disruption on a monitored server.
Alert Supression
EventSentry can keep track of historical performance counter values, and can suppress performance alerts if the current counter value matches a pattern. For example, if the CPU usage of a processor is always high on Thursday between 8pm and 10pm, then, after a baseline is established, EventSentry will check the (continously evolving) baseline and suppress alerts.
Default Packages
EventSentry includes several performance health packages out of the box; templates for Exchange Server, Hyper-V, SQL Server and others help new users setup performance monitoring with just a few clicks. The following default performance monitoring packages are now available:
- Microsoft Exchange Server 2003 & 2010
- .NET & ASP.NET
- Active Directory
- Hyper-V
- IIS
- Sharepoint
- SQL Server
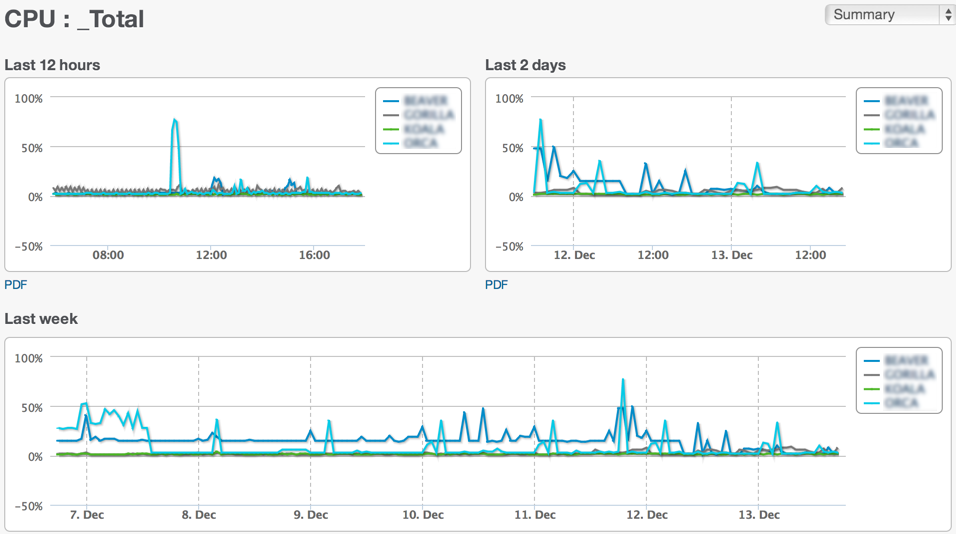
Performance monitoring with the web reports
You can setup EventSentry to record performance data in the EventSentry database. This is particularly useful for analyzing past system and/or application performance to detect future trends and justify system upgrades. See our web reports Event Sentry Performance Charts for example performance charts.
Data collected from Windows agents and SNMP devices is viewed in the same area in the web reports.
Using the performance status report Event Sentry Performance Status, you can also view the current value of any performance counter across all or a selected number of computers, as illustrated in the screenshot above.
Performance history is also extremely useful for software developers, who can now track critical performance information such as:
- Handle Count
- Memory Usage
- Thread Count
- CPU Count
and many of the other counters available through Windows.
 Event Log Monitoring
 Reporting
 Health Monitoring
 Compliance
 ADMonitor
 Management
 Log File Monitoring
 Network Monitoring
 Environment
 Notifications
 Log Consolidation
 Full Feature List