The built-in event message browser lets you view all available event messages that may be logged on your system. You can simply select an event log (e.g. Application) and select one of the available event sources from that log (e.g. ntbackup) and then review all the available Event IDs from that source.
General
When launched from the filter dialog, the event message browser lets you apply the basic event properties to the filter. Additionally, you can also generate the selected event in the event log by clicking the Test button.
The event message browser can be launched from the filter dialog by clicking the Lookup button, or through menu at Tools -> Utilities -> Event Message Browser.
Insertion Strings / Creating Test Events
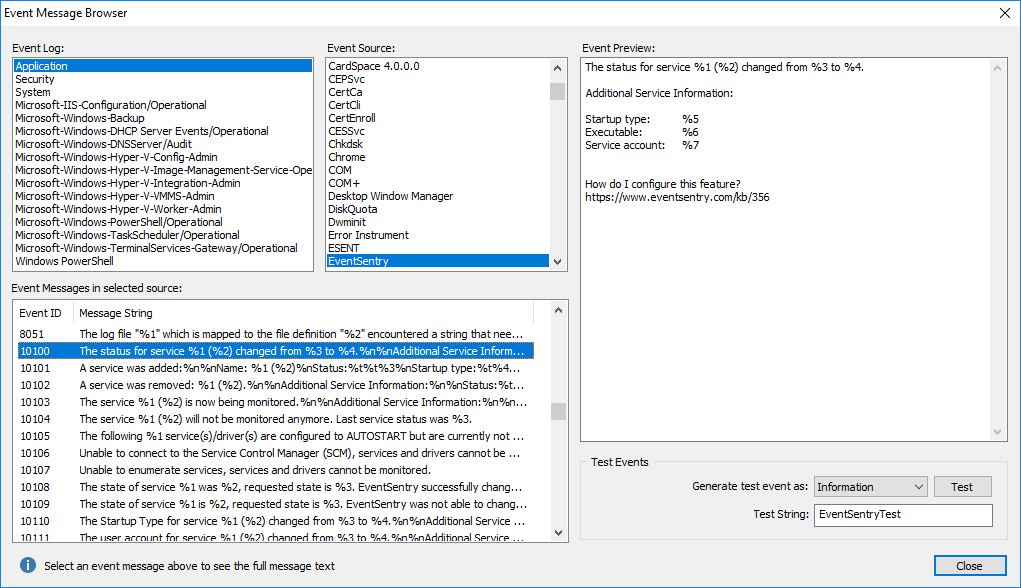
Most event messages use so-called insertion strings, indicated by the percentage sign followed by a number. For example, an event message in the event message browser might include the string %1, which will be replaced with useful data at run-time. For example, the event message (event id 10100 from EventSentry):
The status for service %1 (%2) changed from %3 to %4.
will look similar to the one below when logged to the event log:
The status for service Winmgmt (Windows Management Instrumentation) changed from Running to Stopped.
since EventSentry will replace the insertion strings %1, %2, %3 and %4 with data that is relevant to the current operation. When creating a test event through the event message browser, the insertion strings will all be replaced with the text specified in the Test String field, which is EventSentryTest by default.
|
You cannot create test events from the events in the Security event log with the event message browser at this time. |

The screenshot below shows the event message browser with the above event being displayed: