Windows Counter
This is the name of the actual performance counter, as exposed by the Operating System. You can either
•select a commonly-used counter from the drop-down list
•click the BROWSE button to browse a list of all available counters
•enter the name a performance counter (e.g. Process(*)\% Processor Time) manually
•enter the performance counter IDs (e.g. 238(*)\6) to support this counter on a Non-English Windows OS as well
|
With the exception of some core performance counters like CPU and Memory, the IDs of many performance counters are specific to a machine. Performance counter IDs can be looked up in the registry under HKEY_LOCAL_MACHINE\SOFTWARE\Microsoft\Windows NT\CurrentVersion\Perflib. |

Instances: If a performance counter contains the string (*) then this counter has instances. EventSentry will monitor all instances of a counter, unless excluded (see below).
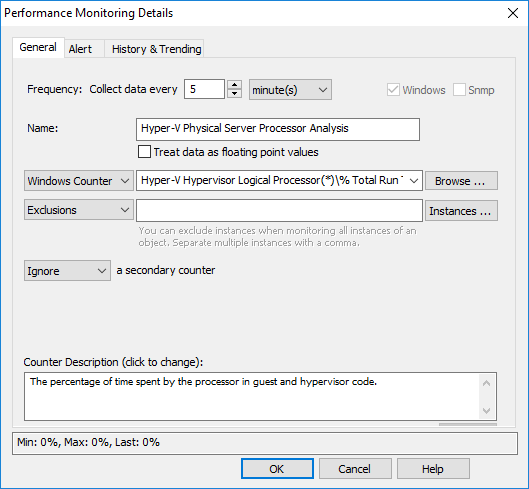
Inclusions / Exclusions
If a Windows performance counter supports instances (e.g. Process(*)\% Processor Time) then specific instances (e.g. _Total) can be included or excluded based on the setting of the drop-down. Multiple instances can be separated with a comma, wild cards are supported.
For example, the Process(*)\% Processor Time performance counter also includes the Idle instance which is always near 100% (since it shows the unused CPU time) and the _Total instance which measures the total amount of CPU time from all applications. Data from these instances is not usually relevant, so they can both be excluded by setting the drop-down to "Exclude" and the field to Idle,_Total.
Clicking the "Instances" button will show all current instance of the selected performance counter, and any exclusions specified will be selected. If a specified exclusion is not present in the list of instances, clicking the "OK" button in the "Performance Counter Instances" dialog will reset the exclusions.
Calculate with a secondary counter
Some performance counters provide additional insight when their values are used in combination with another performance counter. You can add, subtract, divide or multiply the obtained values of a performance counter with/by the values by of a "secondary" performance counter.
EventSentry also provides built-in performance counters:
|
[PhysicalMemory] |
returns the amount of physical memory installed |
[CpuCountLogical] |
returns the number of all available logical processors available (e.g. cores) |
|
[CpuCountPhysical] |
returns the number of all available physical processors |
Use Multiplier
The calculated result can be multiplied with the specified number.
|
By default, EventSentry includes a performance counter called "Memory Utilization", which takes advantage of the secondary counter capability. The primary performance counter (Available MBytes) is divided by the physical memory ([PhysicalMemory]) and then multiplied by 100 (example: 1522/4096 * 100 = 37.16%). |

Counter Description
Shows the performance counter description, usually provided by the Operating System or software manufacturer providing the performance counter.