Performance monitoring allows you to monitor
•All performance counters exposed by the OS and 3rd party applications
•SNMP counters exposed by remote SNMP agents
•Output from command line utilities
|
Performance Monitoring can also obtain data via SNMP from a remote SNMP agent by polling SNMP counter values. The collected data is alerted with and presented in the same way Windows performance data is.
SNMP data is collected by the Heartbeat Agent. |

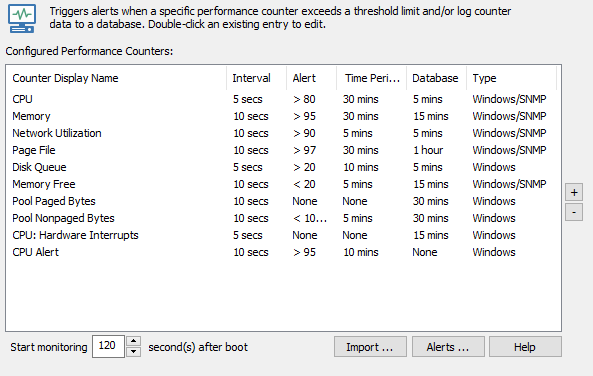
Alerts
Issues event log alerts (which can be forwarded to an action, e.g. email) when a certain performance counter exceeds a configured limit. For example, an alert can be triggered when a process uses more than 70% CPU time for more than 10 minutes.
Alerts are highly configurable and allow you to set how often a performance counter is checked (e.g. every 10 seconds) and how long the counter has to remain above your threshold before an error is logged to the application event log. See Alerts for more information.
Leak Detection
Sometimes applications or drivers can leak resources (e.g. memory, handles) over time, resulting in valuable system resources being over utilized. In severe cases a resource leak can even leak to system instability or a crash. EventSentry can detect some resource leaks with the help of certain performance counters. For example, the following performance counters can be monitored to help detect leaks:
•Process(*)\Working Set
•Process(*)\Handle Count
•Memory\Pool Paged Bytes
Performance Data Collection
Using a database, EventSentry can write performance data to a database which can then be queried through the EventSentry web reports. This allows you see a history of performance data, (e.g. memory usage, CPU usage, etc.) over a period of time using charts and/or raw data.
Performance tracking also allows you to see a current status of all monitored performance counters at a glance to help you get a quick overview of a server's status. See History & Trending for more information.
|
EventSentry ships with a variety of built-in performance packages already setup, including the Performance System package. This package contains language-agnostic counters which monitor system metrics such CPU usage and memory utilization. The counters in this package cannot be deleted or changed as this can break functionality in the web reports. Monitoring intervals of those counters can be adapted, and additional counters can be added to the package. |