Performance alerts notify you when a specified performance counter exceeds your configured threshold by logging an event to the event log. Instead of immediately triggering alert when a performance value exceeds the threshold, all alerts are associated with a time period over which the current performance value is evaluated. An alert will only be logged if the average performance value exceeds the limit during for the configured time period, thus reducing unnecessary alerts.
For example, you can be notified if the % of CPU usage is exceeding 80% over a period of 10 minutes. This means that you will not be notified if the CPU time spikes at 100% for 30 seconds.
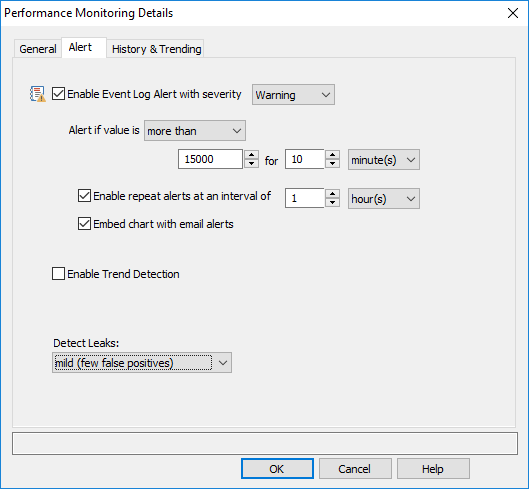
Enable Event Log Alert with severity
Alerts are always written to the event log, and event log filters are needed to forward these events (alerts) to an actual notification, such as email. Select a severity with which alerts for this counter should be logged to the event log.
Threshold Setting (Alert if value is ...)
Configures the threshold settings if the counter value is below, exceeds, falls below, is between or is not between a threshold.
Time Interval
The configured time interval determines how long the counter value needs to exceed your threshold before an alert is written to the event log.
Enable repeat alerts
When "Enable repeat alerts at an interval of" is unchecked, an event log alert will be generated whenever the current (or average) value of the monitored counter changes from a non-alerted state to an alerted state and vice versa. This setting is not recommended for volatile performance counters (e.g. CPU usage), as it can result in a large number of alerts; it is better suited for stable performance counters, such as memory usage, handle count and such.
It's generally recommended to enable this option, so that alerts won't be generated more often than the specified interval.
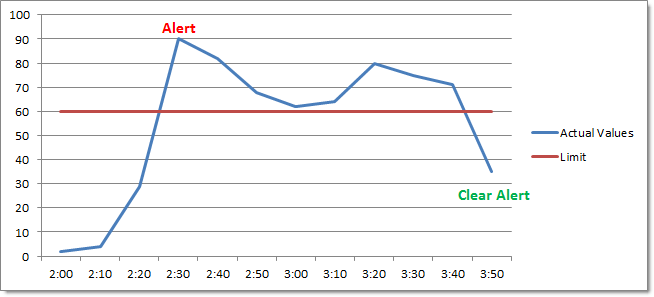
Enable Repeat Alerts OFF
If the time interval is set to 10 minutes and the performance counter exceeds the threshold for 40 minutes, then an alert will only be generated once (after the initial 10 minutes have passed). If the counter however falls back below the threshold however and then jumps back up after some time, then another alert will be generated.
The chart below shows this: EventSentry only logs one alert at 2:30, all the subsequent alerts are considered to be part of the first alert and are thus not generated. The alert is cleared at 3:50.
Note however that a performance counter value which repeatedly moves from an alerted to a non-alerted state may generate more alerts (and "clear alert") events than desired:
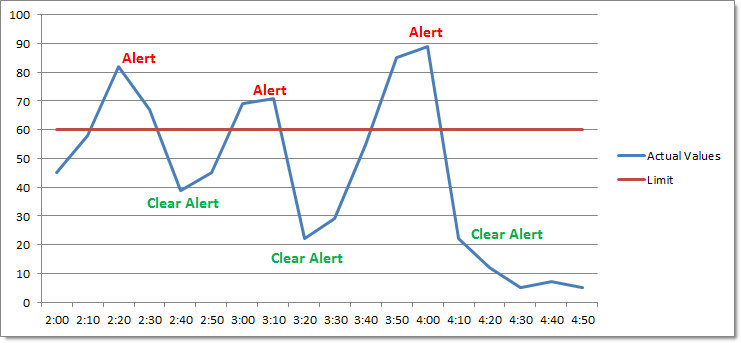
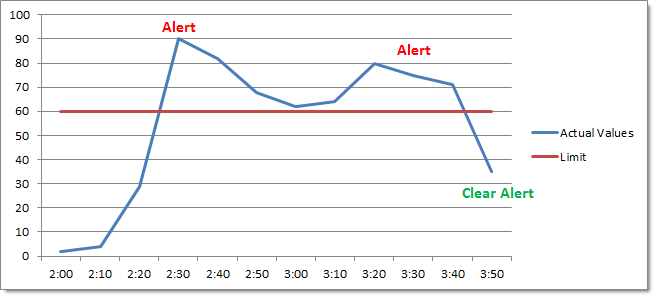
Enable Repeat Alerts ON
If you check the Notify at most every checkbox however and set a time interval, then you will be notified every time this interval has elapsed if the performance counter continues to be in an alerted state. The alert will only stop when the performance counter is back below the threshold.
The chart below shows the same example as above with Notify at most every set to 1 hour. Since the monitored value is still in an alerted state, EventSentry will log another error at 3:30 and clear the alarm at 3:50.
Embedding Charts (for email alerts)
When checked, EventSentry creates a PNG chart from the data collected during the configured time interval (see above, e.g. 30 minutes), and embeds it as the binary data in the event. The EventSentry agent will then attach the embedded binary data as an image to any emails that include the performance alert. As such, this feature is only useful when performance alerts are matched by at least one filter that emails events. The chart includes an automatically calculated trend line in orange.
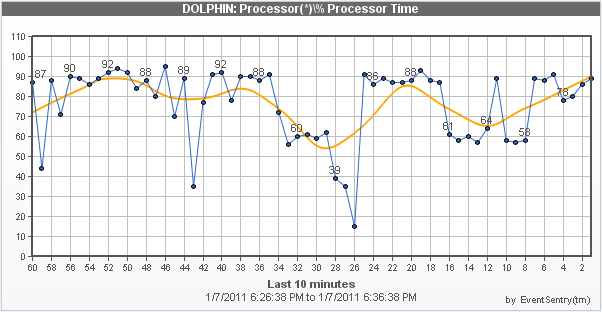
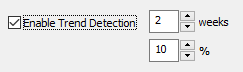
Enable Trend Detection (Windows Performance Counters only)
|
Trend detection suppresses alerts of recurring and expected performance alerts, and works best with percentage-based performance counters like CPU usage. Trend detection keeps track of performance counter value averages, and can suppress alerts when the measured value exceeds the configured hard limit - if the current average matches the historical average.
To consider a performance counter average valid, it has to have been collecting data for at least the set number of "weeks", 2 by default. Once the average is considered valid, it will compare the current counter average with the historical counter average, and suppresses the alert if the current value doesn't deviate more than the configured number of percentage points.
To accomplish this, EventSentry keeps track of the average counter value in 12-minute intervals for every weekday. Counter averages are stored in temp files (%SYSTEMROOT%\EventSentry\temp) with filenames starting with "eventsentry_performance_trend", and remain valid across agent restarts. |
Detect Leaks (Windows Performance Counters only)
Some performance counters expose resources usage of a service, process or service. Leak detection attempts to find objects which leak resources, without the need of specifying hard limits. Leak detection works best for performance counters which count resources (e.g. handle count, working set bytes, etc.), and does not work for percentage-based performance counters.
Leak detections can be configured in three ways:
Setting |
Time period used for analysis |
Description |
Mild |
48 hours |
will detect fewer potential leaks, but generate fewer false positives |
Moderate |
36 hours |
balanced setting between mild and aggressive |
Aggressive |
24 hours |
finds most potential leaks, but will generate the most false positives |
Leak detection can be combined with the numerical comparison of the content filter, to exclude/include leak alerts below or above a particular value. For example, you can enable leak detection for the handle count of processes, but exclude any alerts for handle counts below 5000.
|
Some processes may appear to be leaking resources, when that behavior is in fact only temporary (e.g. database servers) to satisfy requests. It is recommended that historical counter information is also consolidated to a database, so that long-term patterns of the monitored processes can be observed. |
