Collecting performance data in a database allows viewing the current performance status and performance data history through the web reports, using either graphical charts or output in HTML / CSV format.
EventSentry gives you flexibility by allowing you to configure custom database intervals for each counter.
Record in database every ...
Checking this box will record performance counter values at the specified interval. The logging interval has to be equal or higher than the polling interval, since the polling interval defines how often the data is actually being retrieved from the OS.
Keep history
When checked (default), keeps all historical data for this performance value to support viewing trends in the web reports. When unchecked, only keeps the current data of the performance value. This is useful for performance data where only the current value is relevant and keeping historical data is not useful (e.g. toner level of a printer, battery temperature of a UPS).
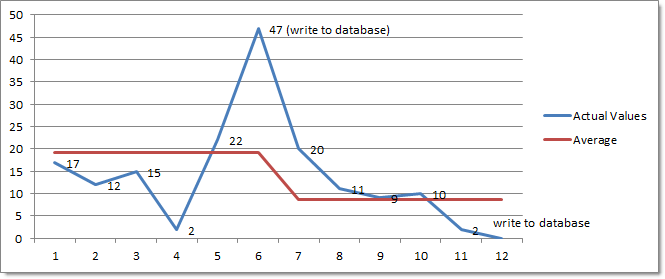
EventSentry writes the average of the data collected over the logging interval to the database. A shorter logging interval will result in a more accurate representation of the performance data in the database, but will take more more space in the database. For example, if counter data is collected every 5 seconds, and the database logging interval is set to 10 minutes, then EventSentry will calculate the average of 120 collected performance values.
Performance data can be written to one or more databases simultaneously.