Event Log Monitoring
Download Now Request a demo
Real Time Event log monitoring is the core monitoring components of EventSentry and its filtering engine gives you countless configuration options to achieve virtually any goal. You define which event log messages you are interested in, and dispatch them to different types of notifications.
For example, you can have database server related messages sent to your dba, while sending all other critical messages to the network administrator.
EventSentry's filtering mechanism is one of the most powerful and flexible available on the market today and can be configured with an easy to use graphical interface. Send event log messages by SMTP email or via syslog, write them to a database or text/html file, (re)start a process or service in response to an event or launch a script or process.
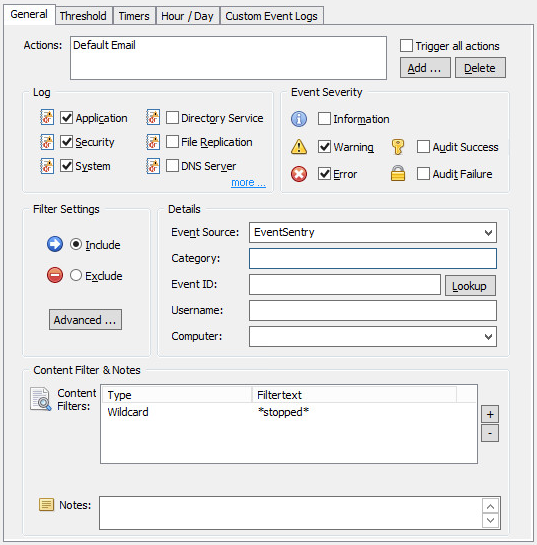
Events can be matched by their basic properties (e.g. event source, category, event id, event message) and by insertion strings inside event messages; wild card matching as well as regular expression matching is also possible which allows for fine-grained filtering.
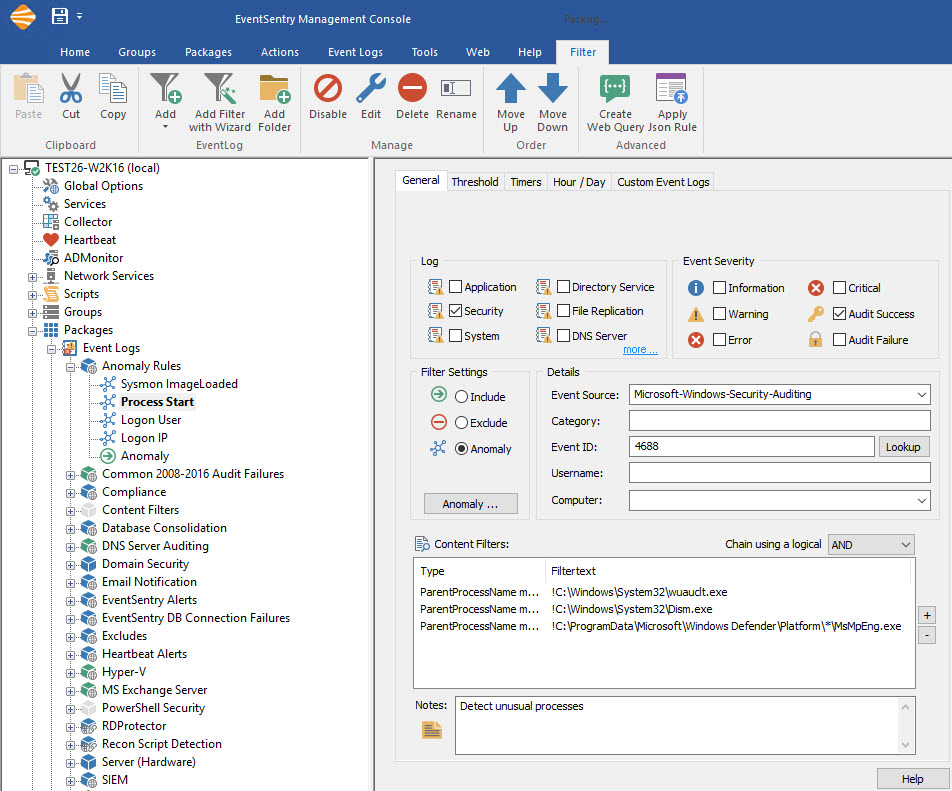
Anomaly detection
The anomaly feature of event log filters helps detect unusual system behavior by examining event data (insertion strings) after a learning period. Anomaly detection can help detect the following:
- A previously unseen user logging on to a system
- A previously unseen IP address logging on to a system or VPN
- A previously unseen process being launched
Anomaly detection can be further enhanced when combined with the Sysinternals Sysmon utility:
- Previously unseen DLL is loaded into a process
- A process connects to a previously unknown IP address
Deep Event Analysis
EventSentry can interpret dynamic event data, for example from Windows security or Sysmon events, and perform additional real-time analysis for enhanced verification of event data, including:
- IP address referenced in an event is (or is not) from an specific country
- IP address referenced in an event is considered malicious
- File name referenced in event has a high entropy (e.g. file is encrypted)
- File name referenced in event does or does not have a valid digital signature
- File name referenced in event matches a checksum
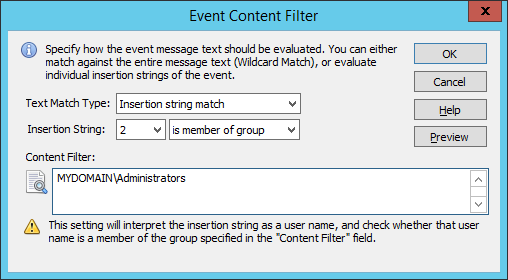
- Username referenced in an event is member of a Windows group
This enhanced event monitoring capabilities give users the ability to gain additional insight into their systems that go far beyond traditional event log monitoring functionality - in real time.
Thresholds & Advanced Features
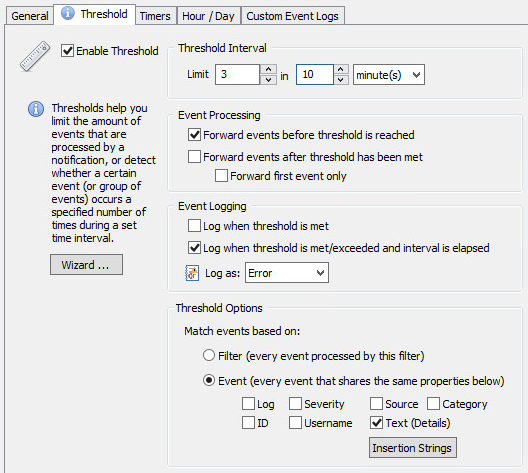
Filter thresholds allow you to become notified when a certain number of events appear during a certain time interval (e.g. more than 10 login failures in 1 minute). Filter thresholds can also be used to suppress events when they reach a certain count.
Threshold can either be evaluated at the agent or - if installed - on the collector. Collector-side thresholds help detect malicious activity like lateral movement (the same user logging into to multiple hosts within a short time period) or processes launching on multiple hosts within a short time period.
Threat Scoring assigns individual threat score values to select event log records, allowing for custom alerting based on cumulative threat scores over configurable time periods. For example, threat scores can be assigned to certain processes being started (e.g. administrative utilities) or changes being made to the system (e.g. scheduled tasks, services added).
The recurring event feature allows you to become notified when one or more events do not occur during a preset time period or interval. For example, you can get notified if a periodically logged event is not occurring, or if a specific task (e.g. a backup) didn't run.
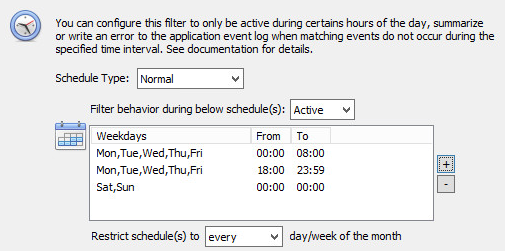
Filters can also depend on the current day or time, making it possible to sends alerts to different notifications depending on when they occur. You can also summarize and collect alerts, and then send out a batch at a given day/time. For example, event logs can be collected during the day, and transmitted to a central database after business hours.
Filter rules can also be set to expire at a certain day and time, making it easy to put temporary filter rules in place that will automatically expire (e.g. maintenance schedules).
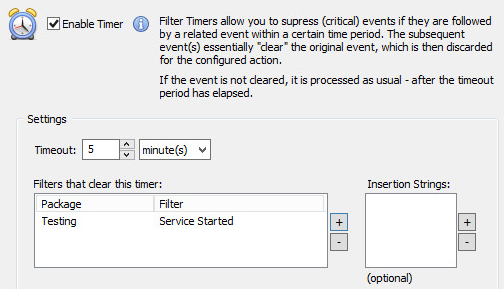
Filter Chaining lets users alert on related events that occur within a specific time period. For example, a file being created and a process subsequently being launched.
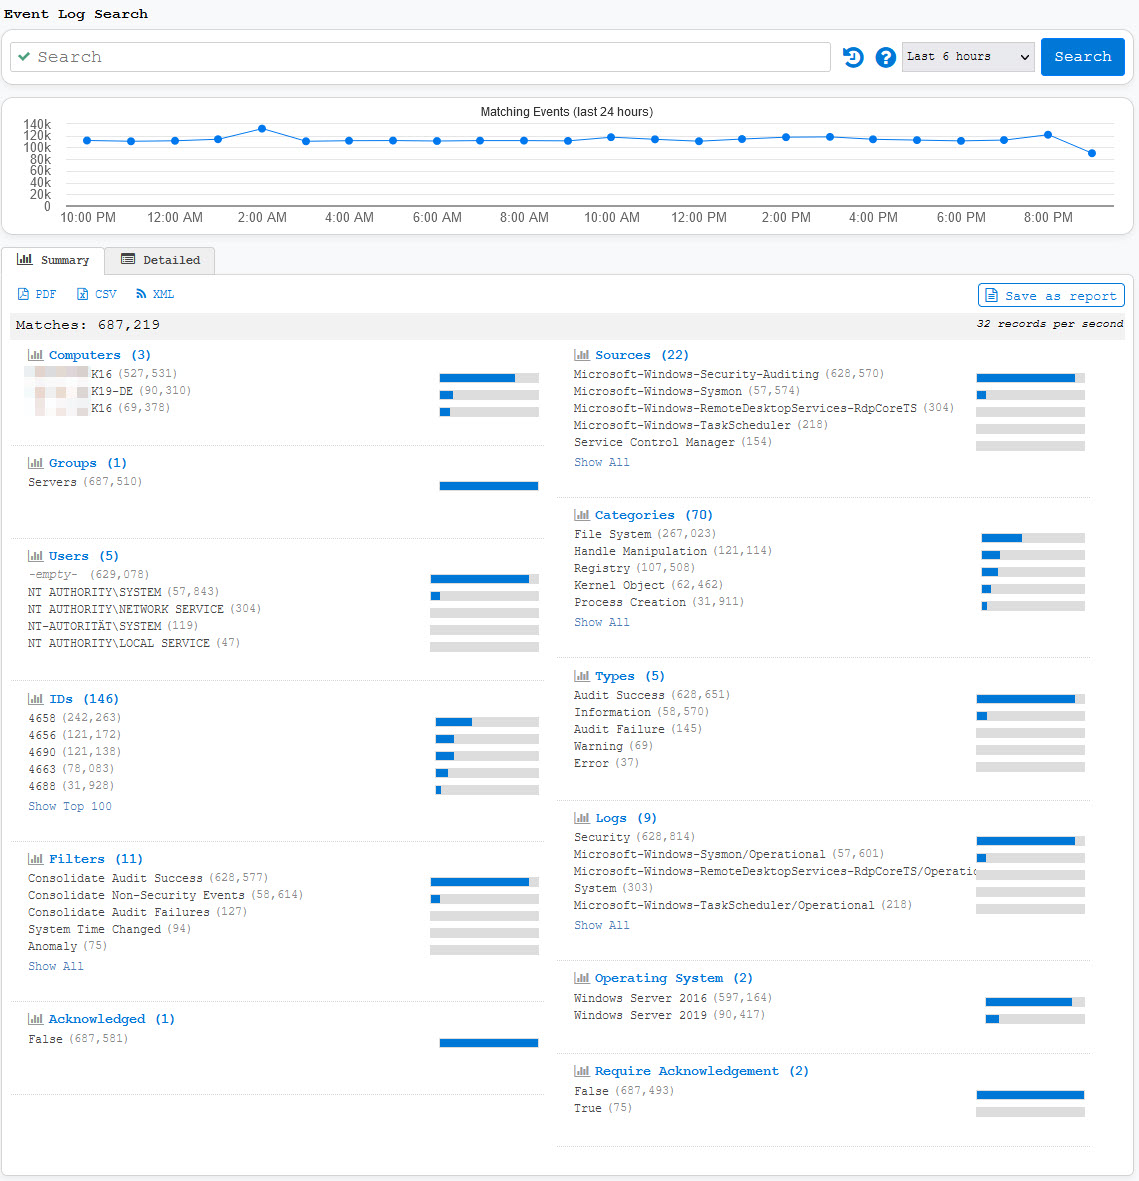
Event Log Consolidation
Event Log Consolidation stores all or some event log entries in a central database (Microsoft SQL Server & PostgreSQL 9x are currently supported). You can then search for events from the EventSentry web reports or create custom reports. Reports can be exported into a variety of formats, including PDF, JSON, XML and CSV.
 Event Log Monitoring
 Reporting
 Health Monitoring
 Process Monitoring
 Compliance
 ADMonitor
 Management
 Log File Monitoring
 Network Monitoring
 Environment
 Notifications
 Log Consolidation
 Full Feature List