System Health Monitoring
Download Now Request a demo
While event log monitoring can relay certain alerts from the operating system, it is unfortunately insufficient for accurately monitoring and tracking a computers health. EventSentry's system monitoring fills this gap, by natively monitoring all core components of the operating system. System Health Monitoring not only raises alerts for immediate problems, but also collects historical information for later analysis, trend prediction and real-time overview.
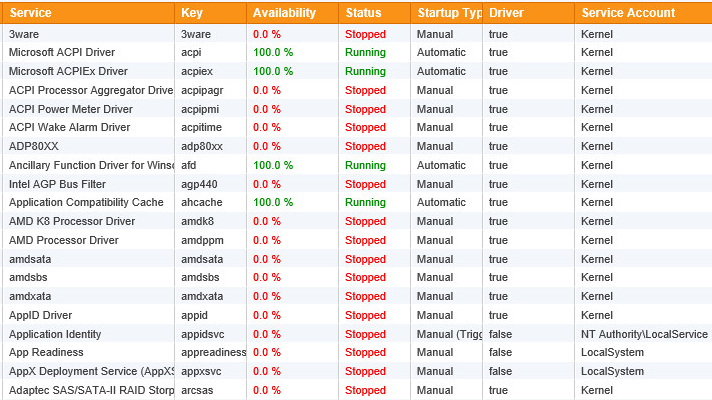
Service Monitoring & Controlling
Monitors services and/or drivers, and notifies you when their status changes or when services/drivers are added or removed. Service controlling ensures that selected services are always in a requested state (running, stopped).
Continuous alerts generate alerts until a service is running again. Service monitoring can also keep a log of all service changes in the database.
More details on service monitoring
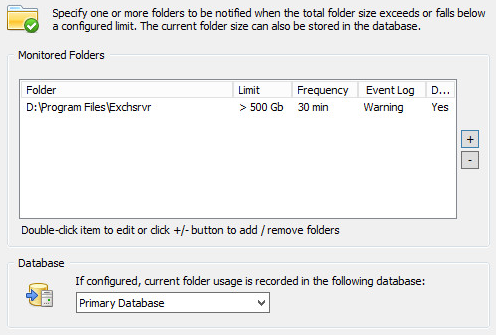
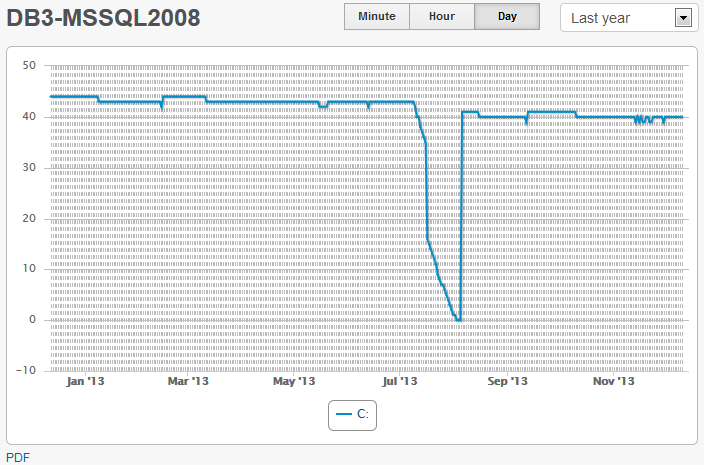
Disk, Directory Monitoring & History Collection
Issues alerts when the available disk space or directory usage is below a certain minimum (absolute or percentage) and detect changes in disk trend usage. You can also collect disk space information in a database and view comprehensive charts (includes disk space charts, disk reports and directory reports) through the web reports. Directory monitoring can monitor selected directories, and large file detection will discover the largest 250 files on a volume to aid with any disk space cleanup task.
More details on disk space monitoring
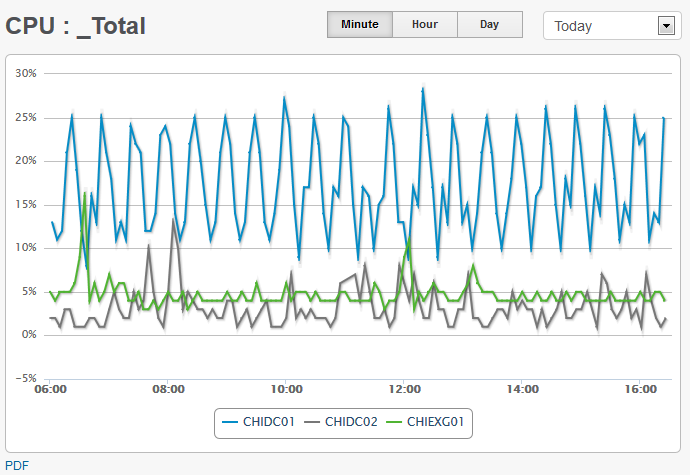
Performance Monitoring
Performance monitoring lets you monitor your servers' system and application performance to detect immediate performance issues and analyze performance trends over time.
You can monitor any performance counter available on the monitored system and either be alerted when a counter exceeds a preset threshold or log counter data in the EventSentry database.
More details on performance monitoring
Process Monitoring
Monitors processes (including command line) to make sure the required number of processes is running at all times. Process Monitoring also provides these additional benefits:
- Shows all running processes across the network
- Shows all processes listening for incoming network connections
- Generates alerts when processes are starting (or stopping) to listen for incoming network connections
Validation Scripts
Managed security & health validation scripts continuously compare critical settings on your monitored hosts with our baseline, immediately indicating potential risks. These checks identify a wide variety of potential risks, such as:
- A Windows server/workstation is not on the latest patch
- Windows firewall is disabled
- No A/V software installed
- Insecure TLS protocols are enabled
- Microsoft accounts aren’t blocked
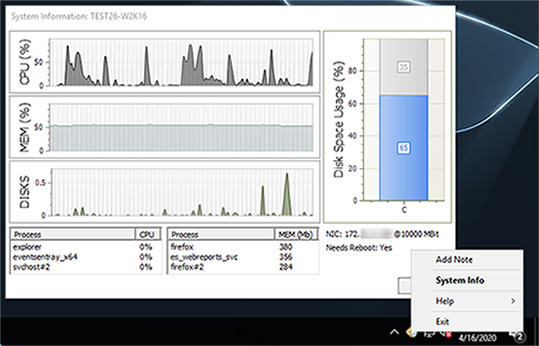
Tray Application "EventSentray"
With the tray app “EventSentray”, your end users can submit support tickets to many common ticketing systems via email or HTTP requests right from the tray with a customizable link. And the best part? Support tickets created by the app not only include pertinent system information (current CPU %, host name, uptime, …) but can also include a current screenshot.
The EventSentray application also provides admins easy access to information like:
- CPU, Memory, Disk Usage & Utilization
- Top 3 apps consuming CPU and memory
- IP address, host name and connection speed
- Whether the host needs a reboot
Task Scheduler Monitoring
Monitors and inventories scheduled tasks from the Windows® Task Scheduler. The inventory capability makes all installed tasks (including tasks nested in sub categories) searchable, including configured actions and triggers. Changes to scheduled tasks are logged to the database and can trigger immediate alerts.
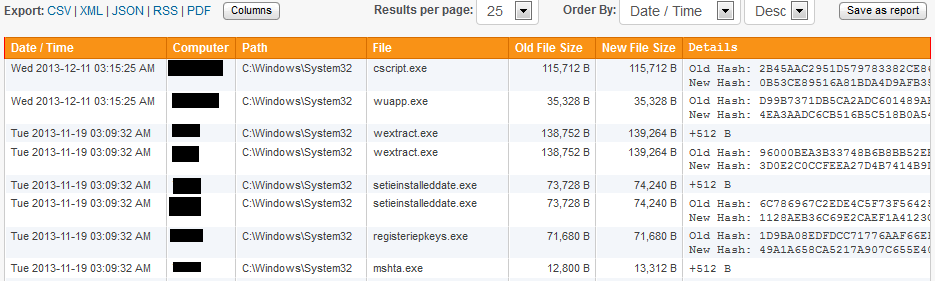
File Change & File Integrity Monitoring (FIM)
File Integrity Monitoring allows you to be notified and track changes to critical system and user files - including NTFS streams. File monitoring detects when files are added, deleted or changed (size & SHA-256 checksum changes) and also obtains file properties like the digital signature and file entropy.
For every directory you monitor, you can specify which types of changes you are interested in. When a change occurs, you can either have an event logged to the event log (and subsequently receive an alert) and/or log the change to the EventSentry database.
More details on file integrity monitoring (FIM)
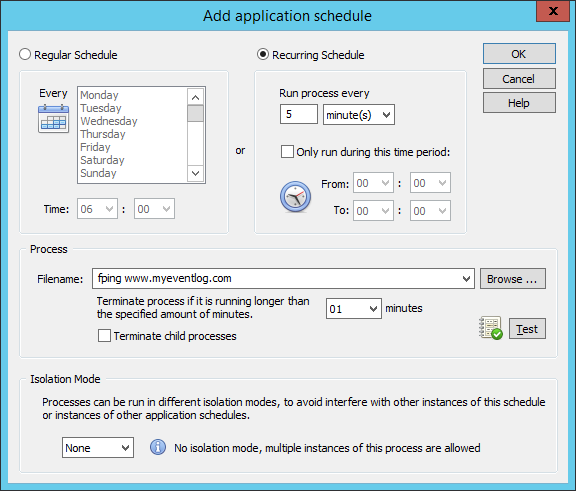
Application Monitoring
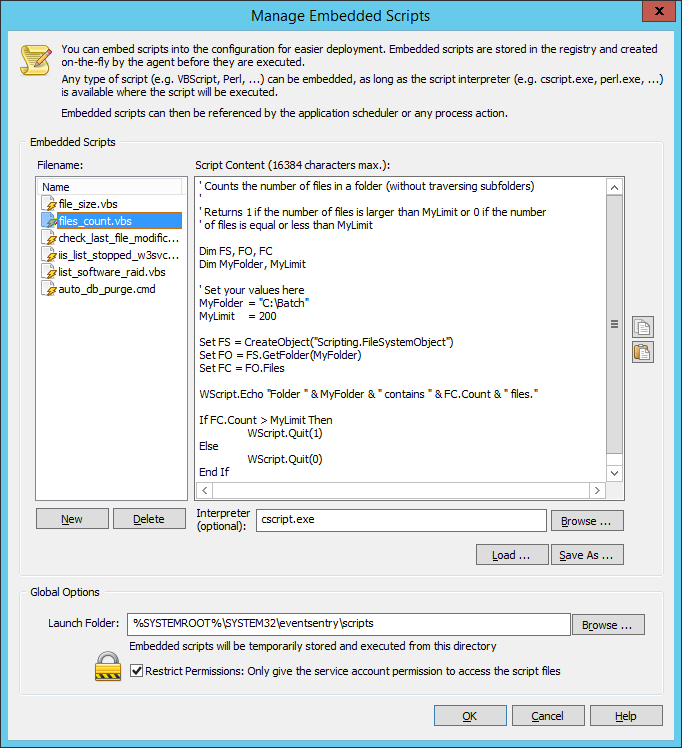
The application scheduler allows you to extend EventSentry's functionality, by integrating your own applications and/or scripts (e.g. batch files, Powershell, VBScripts, Perl Scripts) into EventSentry. Scripts can be embedded into the EventSentry configuration, integrating the deployment of scripts into EventSentry's update process. Your scripts can be scheduled to run at fixed intervals or specific times. Output from command-line scripts can be captured by EventSentry and sent directly to a notification, such as email. This makes troubleshooting failed scripts easy, since any debug output is immediately captured and available to the reviewer.
More details on application monitoring
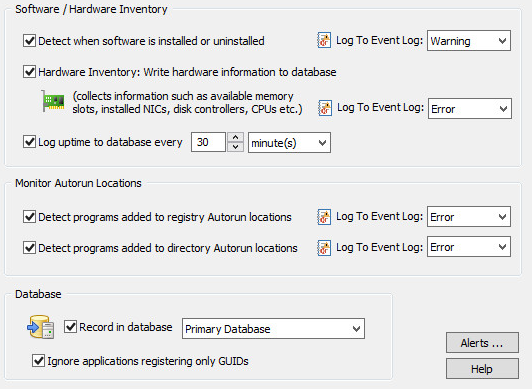
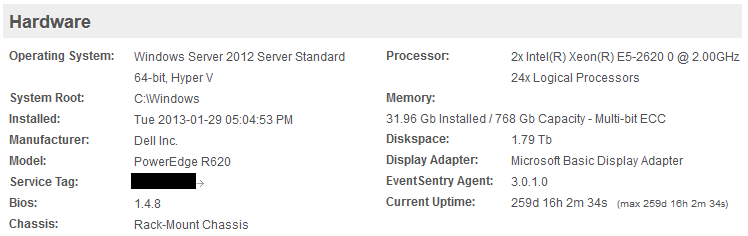
Software, Browser Inventory, Patch & Hardware Inventory
EventSentry offers a complete asset inventory on all monitored hosts:
- Installed Software
- Installed Browser Extensions
- Installed Windows Patches
- Hardware Properties (OS, installed memory, NICs, disks, serial nr, encryption ...)
Changes to installed software and browser extensions is detected in near real-time - alerts can be generated when changes are detected.
In Hyper-V and VMWare® ESXi environments, EventSentry can inventory all virtual machines and their current status.
On supported network switches, EventSentry will tell exactly on which switch and port a particular device is plugged into, so you never have to manually parse ARP tables or follow cables anymore.
More details on software, patch & hardware inventory
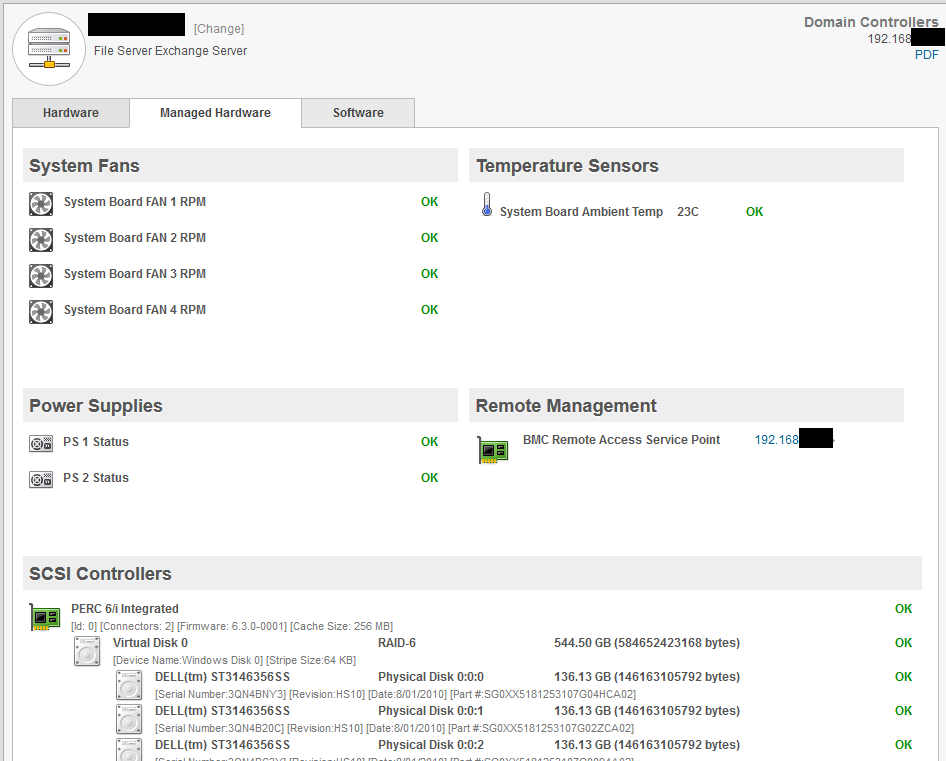
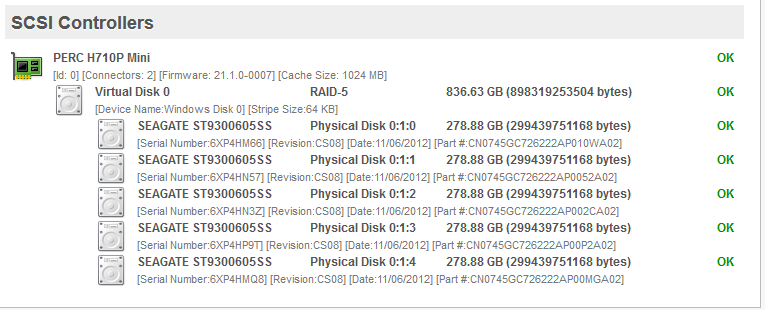
Hardware Monitoring
EventSentry uniformly alerts you about hardware issues liked failed drives, high temperature and other pertinent issues by forwarding events from the event log(s) via email or other alert types (respective vendor management software / drivers must be installed).
On DELL® and HP® hardware EventSentry also collects data about redundant power supplies, fan speed, temperature, remote access cards as well as installed hard disks and RAID configuration and statuses.
Uptime Monitoring
Uptime Monitoring logs the current uptime of a monitored host to the database in a specified time interval. This feature primarily reports the current uptime, but also keeps a history of all recorded uptimes across multiple reboots, which can help isolate problematic servers that are rebooted often. Uptime Monitoring also records the longest uptime ever recorded on any given host.
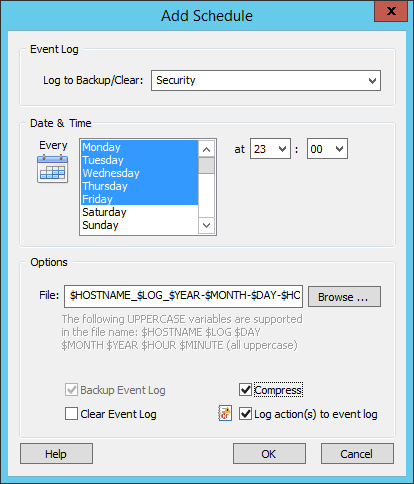
Event Log Backup & Clearing
You can use EventSentry to backup and optionally clear event logs at preset intervals. You determine when to backup which event log and whether the event log should be cleared as well. You can also clear event logs without backing them up.
You can also configure EventSentry to automatically compress event log backup files (.evt and .evtx) in ZIP format to conserve disk space.
NTP Time Synchronization
EventSentry can both verify and synchronize the local time with a RFC 1769 and RFC 1305 NTP server (up to version 3), either in addition to an existing time synchronization (e.g. Active Directory) or as the sole mechanism to synchronize time on all monitored servers and workstations.
When the time between a monitored host and the NTP server is out of sync, then EventSentry will attempt to synchronize the time (if configured) and can also log a message to the event log, reporting the detected time difference.
More details on NTP monitoring
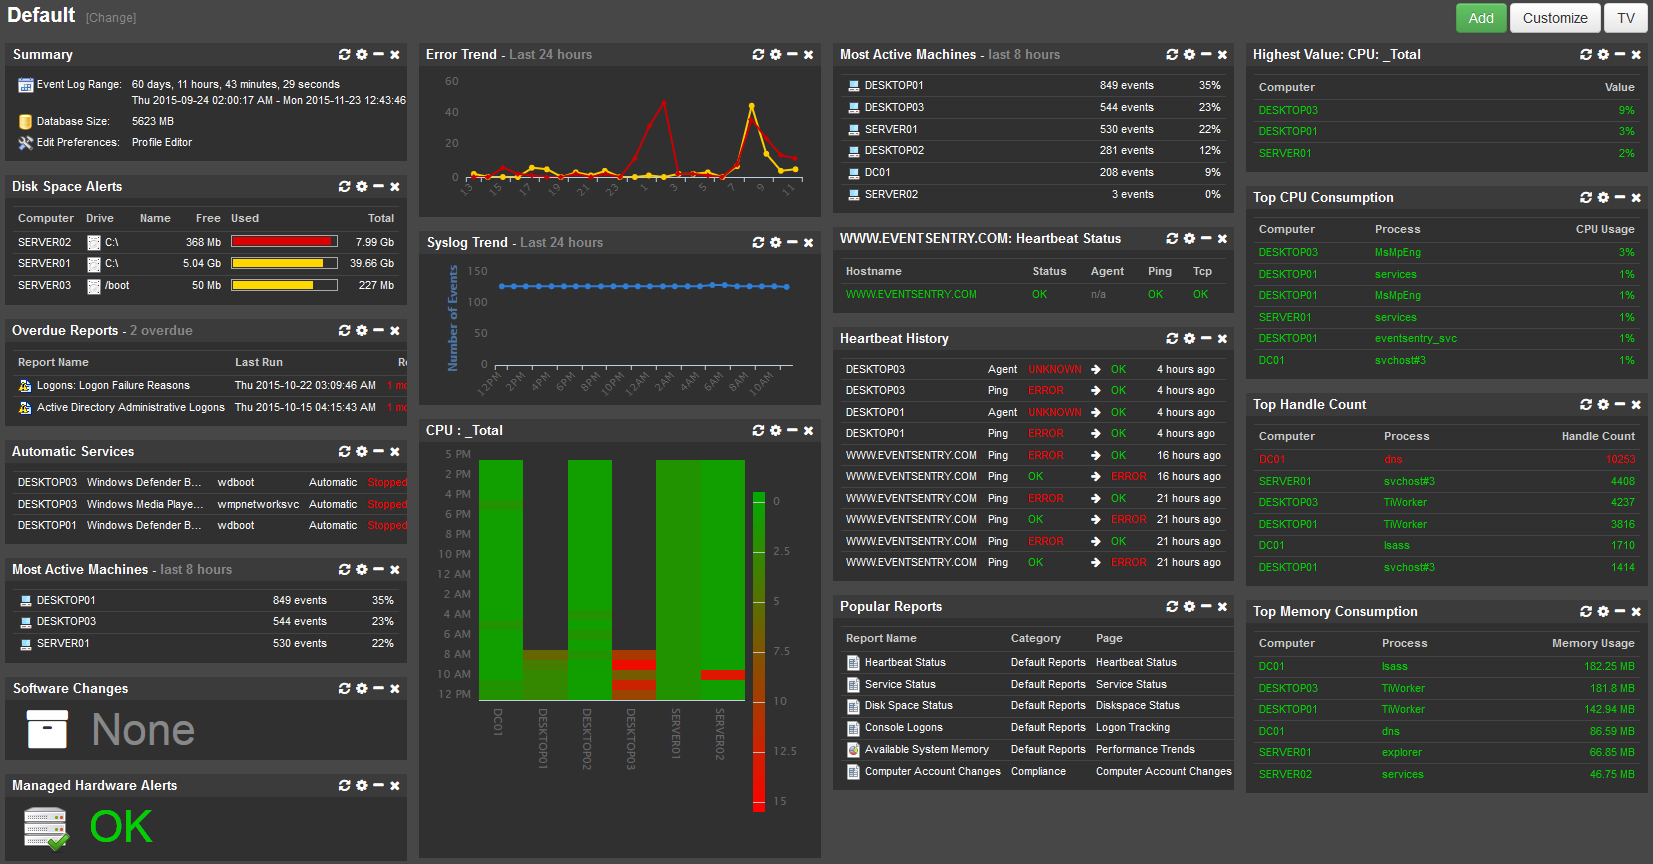
Dashboard
The highly customizable EventSentry Dashboard shows you the overall health status of your network at a glance with easy to read status and historical tiles. The dashboard shows you the following information:
- Any performance counter (e.g. CPU, memory, bandwidth)
- Any system status (service, disk space, ...)
- Top performance (e.g. processes using most CPU)
- Heartbeat Status
- General System Information
- Data from any report (e.g. currently logged on users, service history, ...)
- Log volume trend
 Event Log Monitoring
 Reporting
 Health Monitoring
 Compliance
 ADMonitor
 Management
 Log File Monitoring
 Network Monitoring
 Environment
 Notifications
 Log Consolidation
 Full Feature List