Status
Status tiles are available for the following features / metrics:
•Heartbeat Status
•Disk Space Alerts
•Performance (highest & lowest values)
•Process Performance
•Services
•Warranty Information
•Managed Hardware
History
History tiles are available for the following features / metrics:
•Most Active Machines
•Heartbeat History
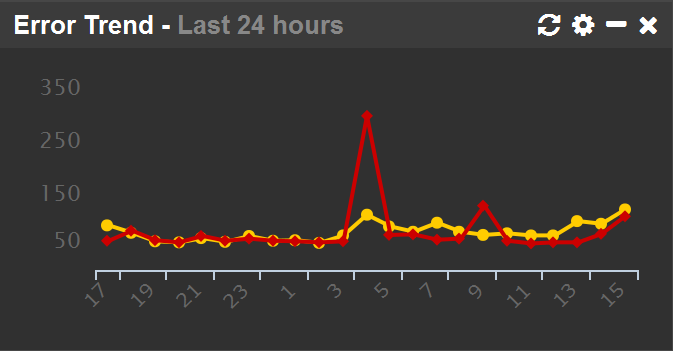
•Trends (Audit Failures, Error, Syslog)
•Events
•Software Changes
•Generic Search
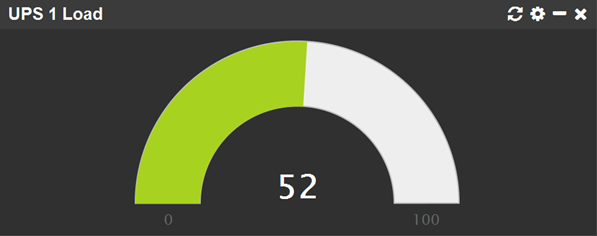
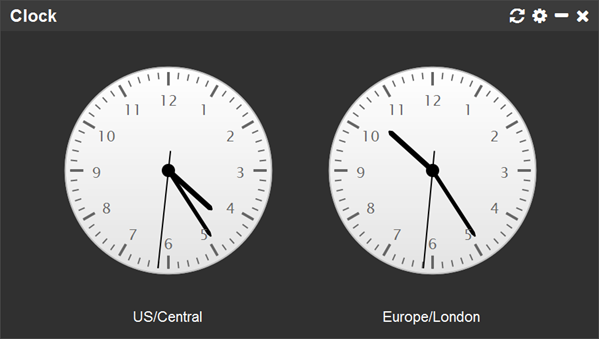
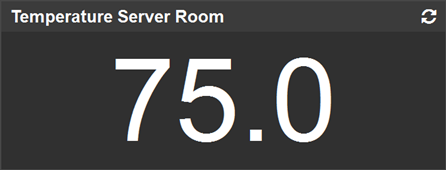
Gauges
Gauges are available on the network status dashboard, and help visualize performance, disk space or environment data. The following gauges are available:
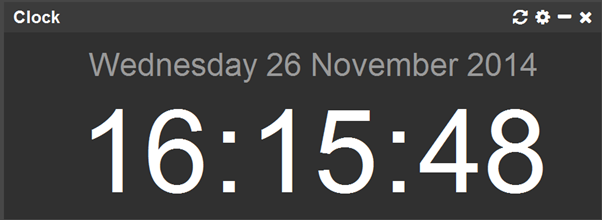
Digital Clock |
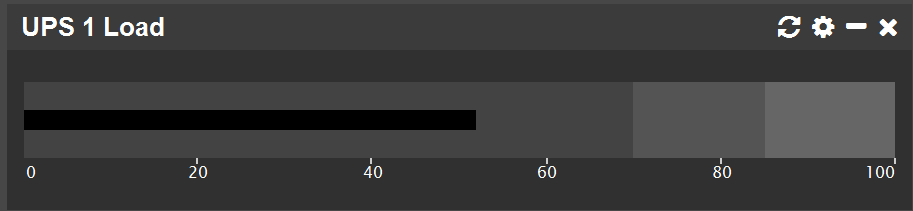
Bullet
|
Meter
|
Analog Clock |
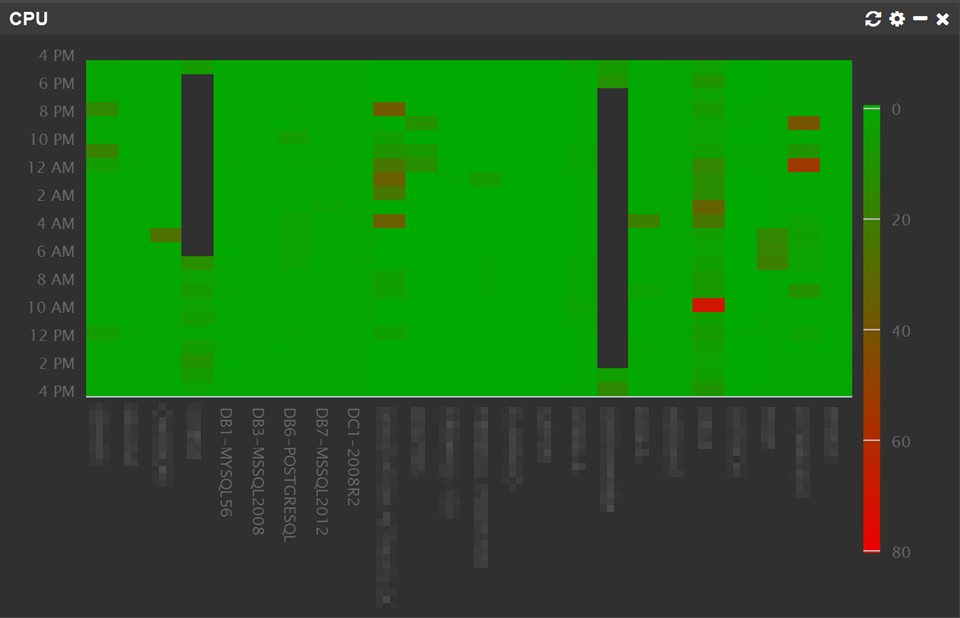
Heatmap |
Number |
Heat Maps
Visualize performance data and log volume over the last 24 hours in a unique way, where the x axis shows every available host, and y axis 24 data points, one for every hour. The scale (displayed on the right) of the chart is dynamic, ranging from the lowest value observed to the highest value observed. The heat map makes it extremely easy to spot anomalies of performance and log data from a group of hosts. Unlike trend charts, heat maps visualizes large volumes of data - even across a large number of hosts - very well.
NetFlow
Includes tiles that visualize NetFlow data, including:
•Threats
•Maps
•Trends
•Network Traffic
•Top Hosts (Top Talkers)
•Bandwidth
•Top Ports
ADMonitor
Includes tiles that summarize Active Directory data, including:
•Statistics
•Changes by user
•Changes by computer
•Group Policy changes
Tile Management
Dashboards support single-width and full-width tiles, and individual tiles can be placed freely on the page. Full-width tiles will need to be placed in the full-width area however, which is configured through the "Layout" option.
Tiles are added by clicking the "Add" button on the lower left corner, a tile can be removed by clicking the "X" button on the top right corner of the tile. Tiles can be minimized by clicking the "dash" icon in the menu bar, and refreshed by clicking the double-arrow symbol.
|
All tiles are available for the network dashboard, but only a small subset of tiles are available for the computer dashboard. |

Moving Tiles
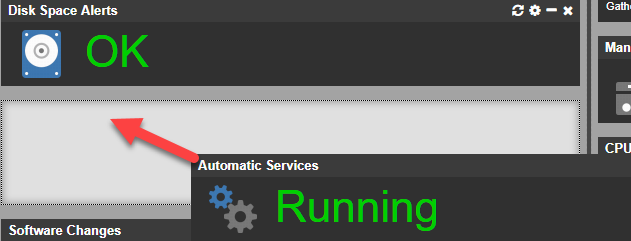
A tile can be moved by dragging it with the mouse to a new location until a gray background becomes visible. The gray background indicates where the new location of the tile is going to be. In the screenshot below, the "Automatic Services" tile is moved below the "Disk Alerts" tile where the gray background is visible.
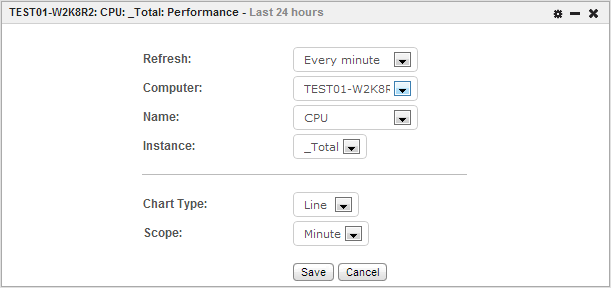
Customizing Tiles
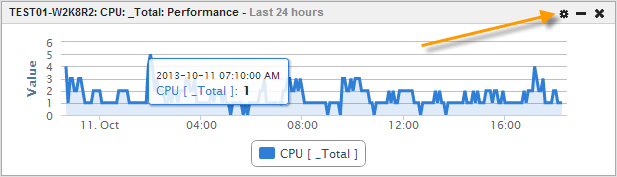
Tiles, once added to the dashboard, can be customized by clicking on the leftmost gear icon in the menu bar. Most tiles allow customization of the automatic refresh interval, the computer from which the data should be obtained, and tile-specific settings. The screenshot below shows a performance tile and its configuration.