The Network and Computer dashboard pages are customizable views of one more more tiles showing recent logs entries, trends, system health statuses and more. The network status and health matrix dashboards are discussed separately:
Multiple Dashboards
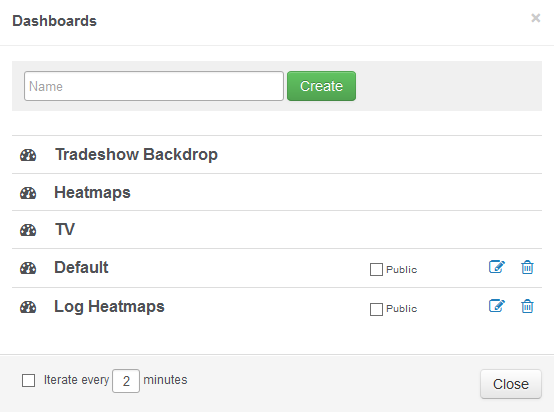
The Network Dashboard supports multiple dashboards which can be shared between users and iterated between.

TV Mode: Click the TV mode button to put the dashboard into full-screen mode. Screen real estate can be further maximized by utilizing the web browser's full screen mode. Please note that iterating through multiple dashboards will exit out of a web browser's full screen mode.
Creating a new dashboard: To add a new dashboard, click the [Change] link on the top left of the screen and selecting Edit. In the resulting screen specify a name for the new dashboard in the "Name" field and click Create.
Sharing a dashboard: A dashboard can be shared by checking the "Public" check box. This dashboard will then appear in the list of dashboards for all others users. Dashboards already shared by other users will appear in the list without the "edit" and "delete" buttons.
Iteration: Instead of displaying only one dashboard, the dashboard page can automatically iterate between all available dashboards every X minutes. Check the "Iterate every" check box and configure a time interval. TV Mode is not available on most platforms while iteration is enabled.
Editing Dashboards: Dashboards can e renamed with the "Edit" button next to the trashcan, dashboards can be deleted by clicking the "Trashcan" button.
Tiles
The network and computer dashboards distinguish between the following tile types:
•Status
•History
•Gauges
•NetFlow
•ADMonitor
Status Tiles
Display the current status of a specific metric, e.g. the heartbeat status or a performance counter. Most status tiles display "OK" when no issues have identified, or the list of warnings and/or errors.
History Tiles
Displays recent changes/events about a monitored metric, such as the most recent service status changes.
Gauges
Display the current status of performance, disk space or environment sensor value. Gauges are only available on the network dashboard.
See tile types for more information.
Layout
The layout can be customized by specifying the number of columns (2 - 4) and the location of the full-width tile (top or bottom). The full-width tile can optionally be disabled as well, useful if you are not utilizing a full-width tile. The screenshot below shows some of the available layout options.
