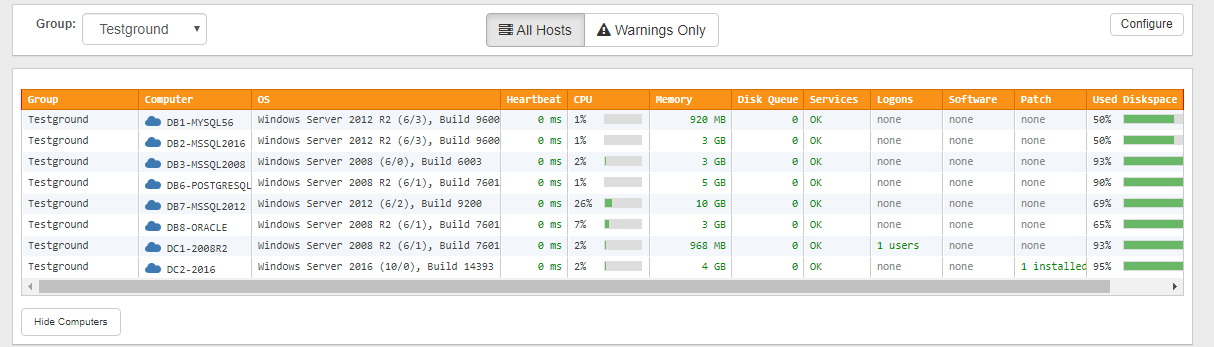
The network status page provides an overview of the overall health status of all monitored servers and workstations on your network using little screen real estate. By default, the network status page shows the current value of 3 key performance counters (CPU, memory and disk usage), but can be customized to show the current status of additional performance counters as well.
|
Some columns are click-able and will transfer to a different page (e.g. clicking "Computer" will transfer to the "Computer Dashboard") when clicked. |

Fields
Heartbeat: |
Response time of the remote host in ms, or "ERROR" if host is offline. |
Services: |
Shows OK if all services configured for automatic startup are running, otherwise shows the number of stopped services. |
Logon: |
This values shows how many users are currently logged on to the machine. |
Software: |
This value shows the number of applications or patches installed today. |
Customization
Clicking "Show Warnings Only" will only show hosts where at least one monitored component is in a warning or error state.
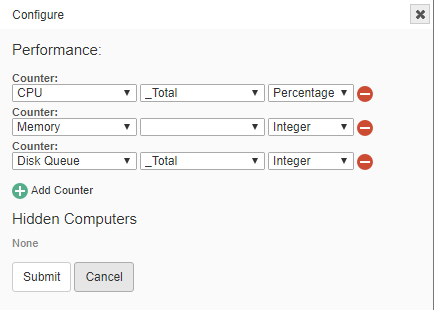
Clicking "Configure" will bring up the configuration dialog, allowing the customization of existing performance counters as well as the addition of new performance counters.