All pages returning data in textual form (e.g. event log data, syslog data, SNMP data, file checksum data etc.) provide both a "Summary" and "Details" view of the data. The summary view groups data from all relevant data fields to provide an overview of recent data collected by the currently selected feature.
On pages displaying historical data (opposed to pages showing current data, like "Performance Status") the summary view also provides a time line to visualize the distribution of data over the last 24 hours.
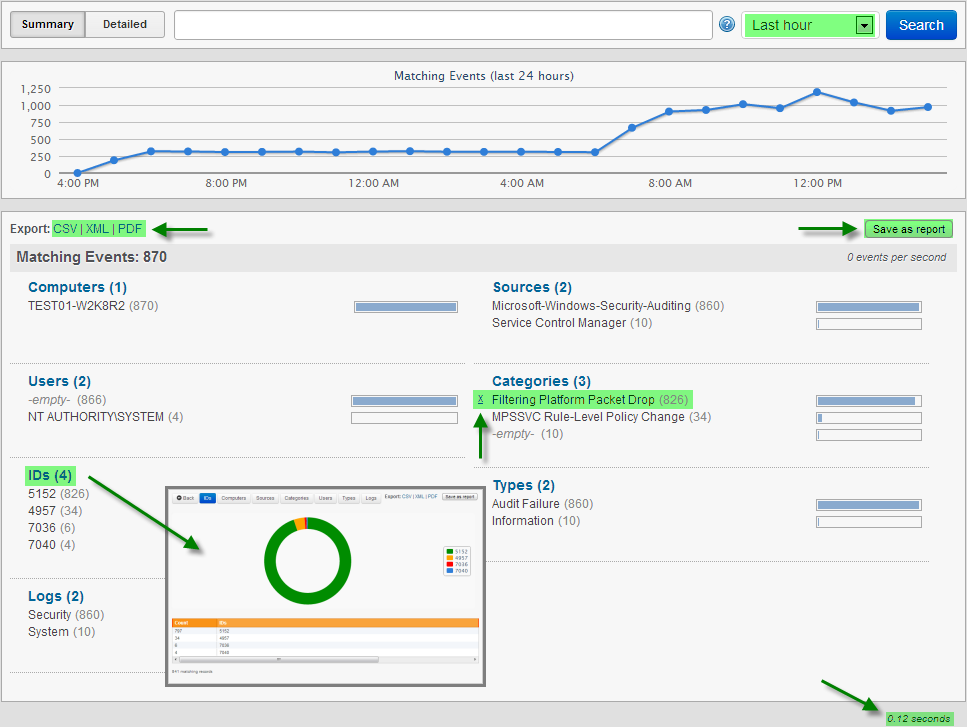
Summary / Detailed
Toggle between summary and detailed view. Any custom query is applied to both views. Clicking the "Last Hour" drop-down changes the time period for the current report.
Export Options
Data can be exported in the CSV (comma separated values), XML and PDF format. Frequently accessed search queries can be saved as reports using the "Save as report" link. Reports can be set as the default view for a page and scheduled with jobs.
Group Headers
Clicking on any group header switches to the "group output" page which will display a pie or stacked bar chart.
Including Items
Clicking on an item will update the query and reload the page so that only records matching that item will be returned.
When hovering over an item in the summary view, a little X will appear next to the text. Clicking on the "X" will refresh the page and exclude this item.
The bottom right shows the load time of the page.