All pages retrieving raw log data (e.g. event log, log files, Syslog, SNMP traps, ...) and EventSentry log data (e.g. software installation history, file checksum history) display data in both a "Summary" and "Details" view.
Both views access the same data but display the data differently. The "Summary" view provides a high-level, categorized overview of the collected data to allow the user to quickly understand the type of data that has been collected in the database. Both views share a common page header which includes the search (query) field and the 24-hour trend graph.
The "Detailed" View gives access to the raw data, allowing for a detailed investigation of the collected log data.
|
Recommended procedure when investigating log data:
1.Access the "Summary" view of the respective log data 2.Narrow the search down by excluding certain items either by utilizing the "X" button or by creating a query 3.Customize the date/time range as well as output count 4.Switch to the "Detailed View" |

Time Range
Use the time selection drop-down to customize the time range of the displayed data, 1 hour by default. Select "Custom Range" if the desired time range is not pre-populated in the list.
Query Language
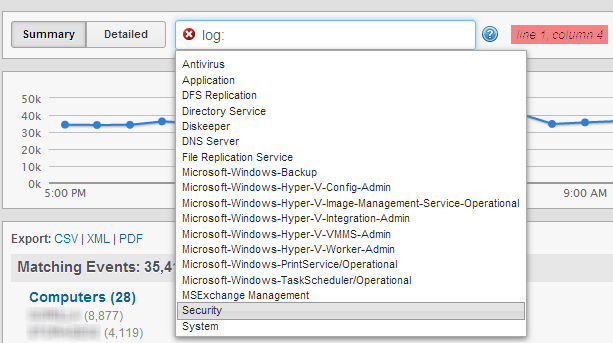
The EventSentry web reports use the Apache Lucene Query Parser Syntax. You can build basic queries by either excluding items (when in the Summary view) or by clicking the search field with the mouse, selecting a field and specifying a search value. See Query Syntax for more information and examples.
|
You can continue to click on the search field and build your query until it is complete. When building a query using only the mouse, the default logical operator is "AND". |

If the query syntax is incomplete or incorrect then the search field will show a read X on the left side, as well as details about the location of the error on the right hand side. The search field will show a green check mark if the query syntax is correct.
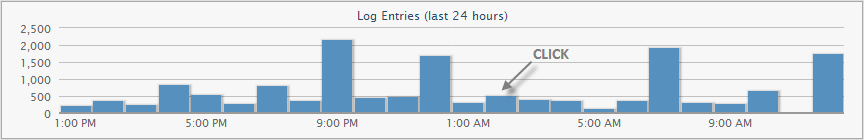
24 Hour Trend
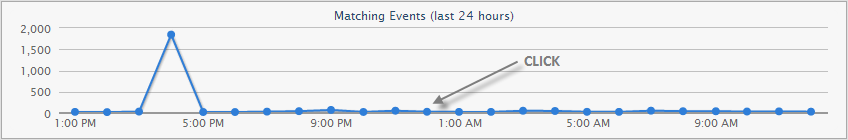
The 24-hour trend shows a trend line for the current query over the last 24 hours (regardless of the selected time limit). Clicking on a data point on the trend line will narrow the search down to that hour of the day. Depending on the feature, the trend line will either be a line or a bar chart.
Trend Chart for Event Log Search
Trend Chart for Log File Search
|
The trend line will always show data from the last 24 hours, regardless of the currently selected time range. |
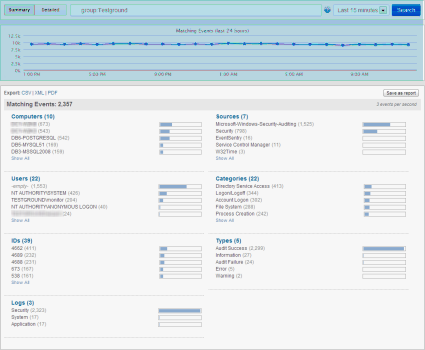
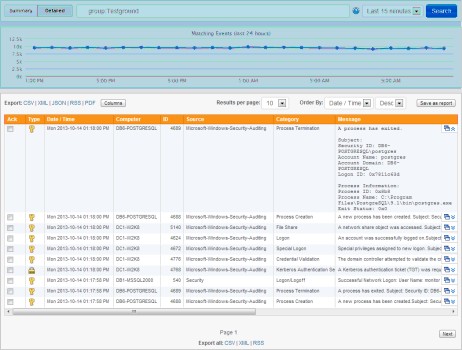
The screen shots below show the summary and detailed view of the same data side-by-side. Both views include the search bar, time period selection and graph.
Summary View |
Detailed View |