Visual trends visualize numerical data from the following features:
•Performance
•Diskspace
•Environment (Temperature + Humidity)
•Ping Response
•NetFlow Bandwidth
All trend pages can be exported to PDF format.
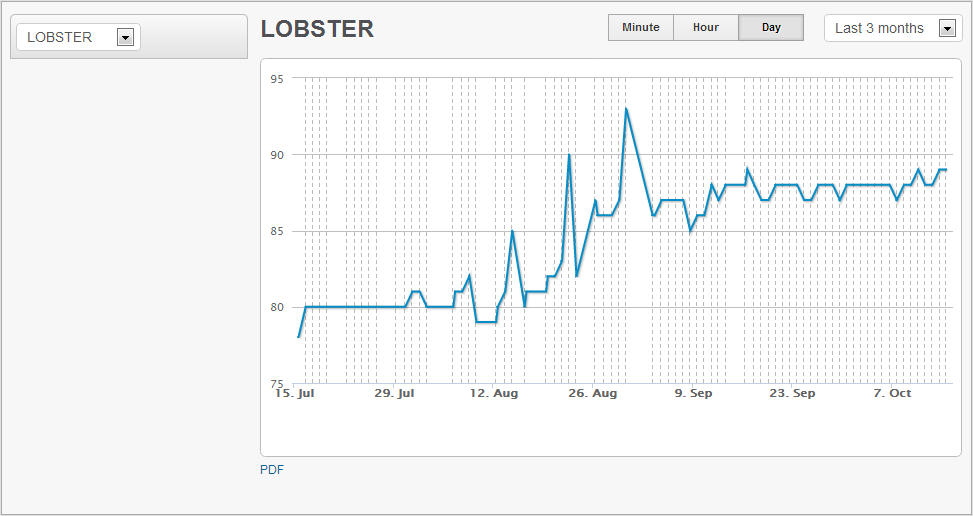
Host Name & Feature Selection
All trend pages show the host name selection on the top left, with advanced configuration options specific to the feature right below it.
Time / Date Range
The time / date range for the trend is selected on the top right and ranges from "15 minutes" to "Last Year". Select "Summary" to view three combined charts for the
•Last 12 hours
•Last 2 days
•Last week
A custom range can be chosen with the "Custom Range" option.
|
The "Summary" view is the recommended initial view and will provide the best data presentation. |

Chart Accuracy
The accuracy of the chart, provided enough data is available, can be controlled with the "Minute | Hour | Day" buttons:
•Day (least accurate, fastest load time)
•Hour (accurate, average load time)
•Minute (most accurate, longest load time)
|
"Hour" is a sensible choice for most charts, except for charts covering more than one month. "Minute" is only recommended for short time ranges of approximately a day. |