|
Environment
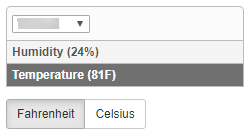
All available sensors (Temperature, Humidity or both) are shown below the host name, including their most current readings.
The unit of measurement for temperature can be switched between Fahrenheit and Celsius. |
|
Disk Space
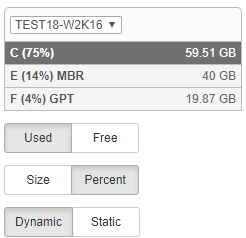
All monitored drives are shown below the host name, including the volume name, percentage of disk space used and the total disk space of the volume on the right hand side.
The charts can be configured to:
•Show used space or free space available •Display percent or size
Dynamic vs Static "Static" will show the full range on the Y axis (e.g. 0 - 100% when choosing "Percent"), whereas "Dynamic" will dynamically scale the Y axis based on the data shown in the chart. |
|
Performance
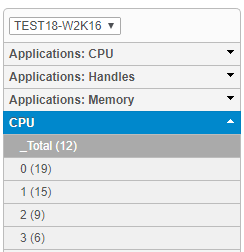
All performance counters available on the selected host, including their most recent values, are shown below the host name.
Performance counters with multiple instances can be clicked, which will expand and show all available instances. Instances or counters which are in an alerted state will show in red.
Clicking on "Counter" will switch to the performance-counter centric view, which shows the performance history of one or more computers of a counter in one chart.
|
||
|
NetFlow Bandwidth
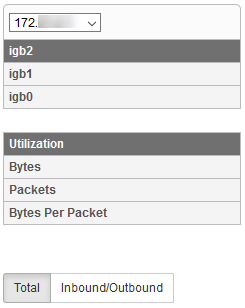
Shows the IP address of the NetFlow exporter along with all interfaces for which NetFlow bandwidth information is available. ' For each interface the following metrics are available:
•Utilization in percent (only available if NetFlow can determine the interface speed, either manually or via SNMP) •Bytes •Packets •Bytes Per Packet
Total shows the combined number of inbound and outbound bytes. Charts that distinguish between outbound and inbound bytes is only available when supported by the exporter, otherwise Inbound/Outbound charts will be empty. |

Network Quality
Select a host to view the ping response time of the select time period.