Monitoring and viewing COVID19 stats in the EventSentry Dashboard
Note: This article AND script have been updated on 3/25/2020 to use a more accurate data source - please update your script. Countries must now be specified by their English name and NOT by the country code.
This article outlines how to monitor current COVID19 stats by displaying on an EventSentry dashboard and/or receiving email alerts using embedded scripts and performance monitoring.
The PowerShell script used in this example pulls data from https://github.com/CSSEGISandData/COVID-19/tree/master/csse_covid_19_data/csse_covid_19_daily_reports, download is available at the end of article.
Creating an Embedded Script in the EventSentry Management Console
In the Tools menu (1) of the EventSentry Management Console, select Embedded Scripts (2) and click the New button (3). Give the script a descriptive name (4) (e.g. COVID19.PS1), paste the attached script content (5), and select the correct PowerShell interpreter from the drop-down (6) and click OK (7).
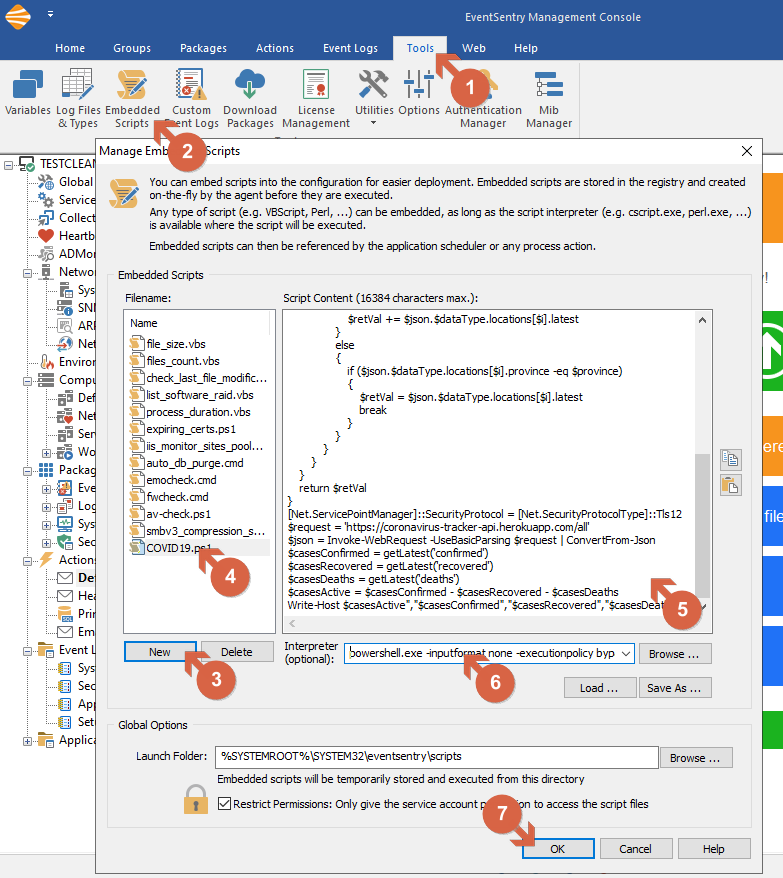
Fig.1: Creating an Embedded Script
Create a system health package with Performance Monitoring object
Expand Packages in the management console, right-click System Health (1) and click Add Package (2). Give the package a descriptive name, e.g. "Covid19".
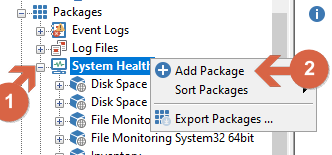
Fig.2: Add New Package
Next, the package needs to be assigned to the host where it will be executed from. Select the package (1), click Assign and select the machine (3) to assign it to. It's generally not necessary to assign this to multiple hosts since only one host needs to execute the script.
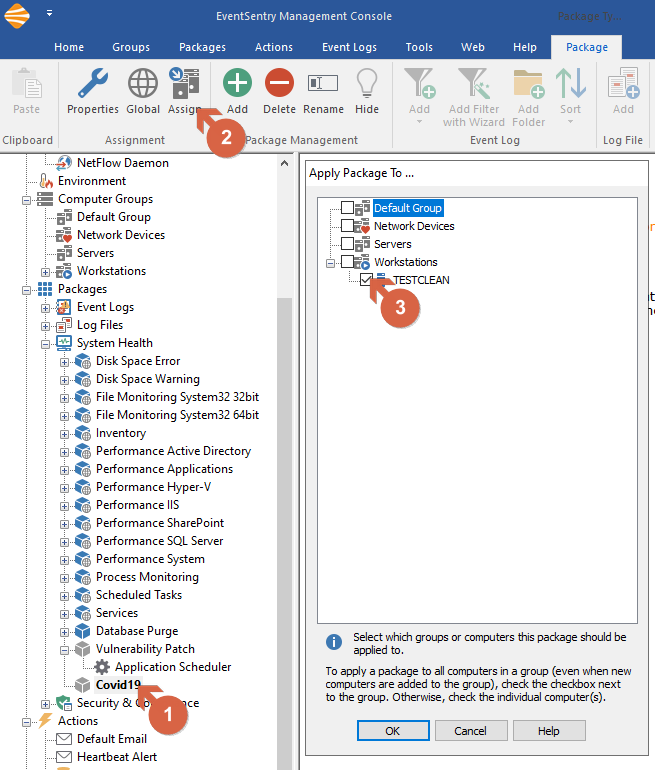
Fig.3: Assigning the Package
Next, ensure the package is no longer gray and still selected (1), click on Add (2), choose Performance / SNMP object (3) and select the new object on the left of the tree view.
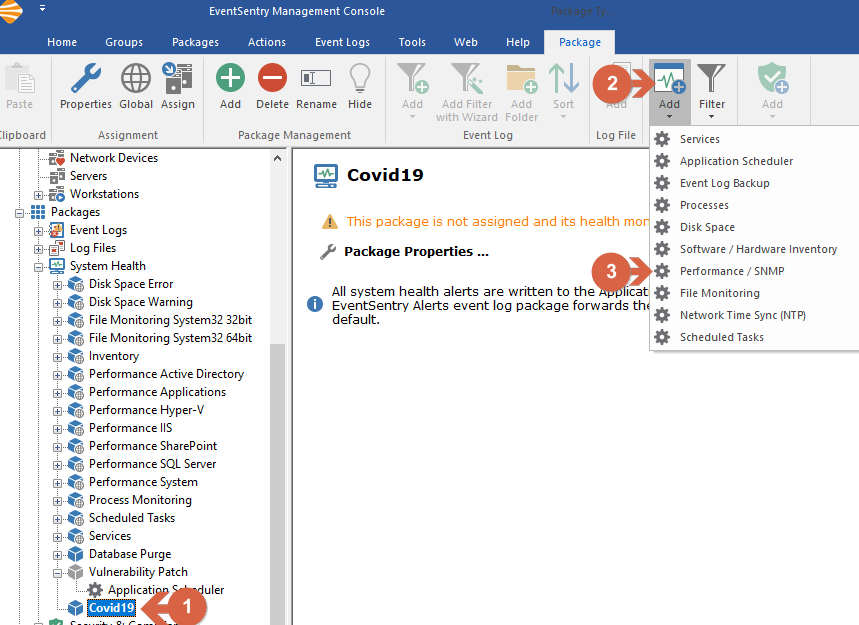
Fig.4: Adding Performance / SNMP object
From the resulting dialog, click on + (1) symbol to add a Performance Monitoring object. From the Performance Monitoring Details dialog select a collection interval of 30 minutes (2) for this test, enter Covid19 World as a name (3) and from drop menu change "Windows Counter" to Executable (4). On the input field adjacent to the right select @covid19.ps1 from the drop menu and then click on Instances (5).
Note: You can add different Counters for different countries, states or even counties by adding the country code as the first argument and, if available, the name of the state/province as the 2nd parameter. For global stats omit any parameters and just execute the script as is. Examples:
@covid19.ps1 US Illinois

@covid19.ps1 US Illinois Cook

@covid19.ps1 Austria

@covid19.ps1 Italy
See the video below for more information.

Fig.5: Configuring Performance / SNMP object
From the Instances Windows, select the comma separator "," since the PowerShell script returns all values in CSV format. Specify the field names - which is again dictated by the script - as Active,Confirmed,Recovered,Deaths and click OK.
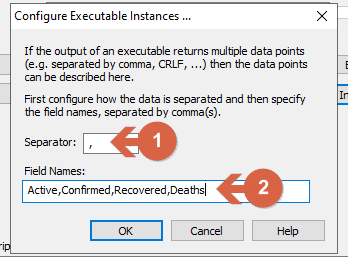
Fig.6: Configuring Instances
Finally, click on the History & Trending tab (1), and choose how often data is written to the database. In this example record every 1 hour (2), but any interval that is a multiple of the monitoring interval specified on the "General" tab works. Click the Add button (3) to select the Primary Database (4) (or another) action.
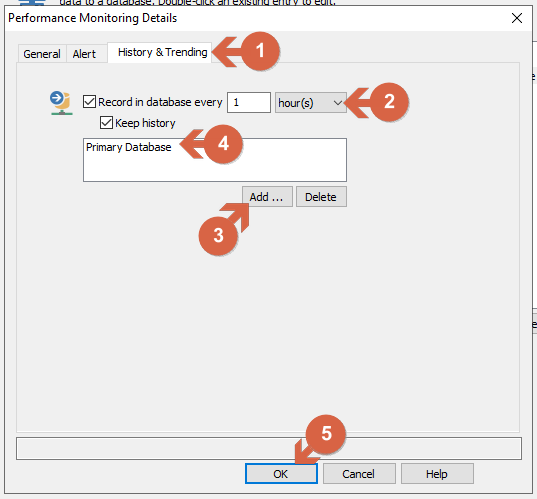
Fig.7: Configuring History & Trending
Note: You can also configure (email) alerts when any of the instances exceed a threshold on the Alert tab.
Adding a dashboard tile to the WebReports
In the EventSentry Web Reports select an existing dashboard or create a new one, and click the green + button (1). This will present the "Add Tile" window where the "Number" tile (3) can be added from the "Gauges" (2) tab.
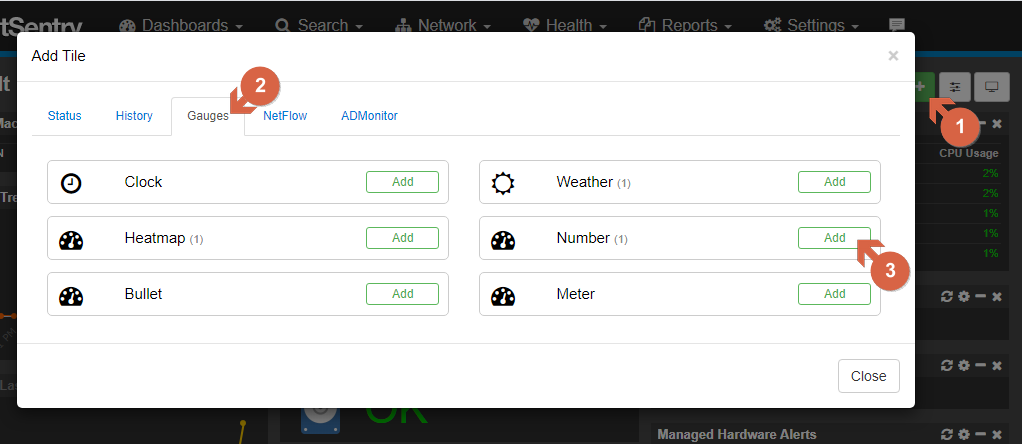
Fig.8: Adding Tile to WebReports
After the tile has been added to the dashboard and moved to the correct position, click the gear icon (configuration), enter a descriptive title (1), select "Performance" as the type, select the computer to which the package was assigned to and finally select the correct performance name - Covid19 World in our example.
Important Note: Since the script only writes to the DB hourly, the Covid19 World option won't be there until the first database write occurs. If you're a fan of instant gratification then you can temporarily configure smaller intervals and then change the interval back to 1 hour.
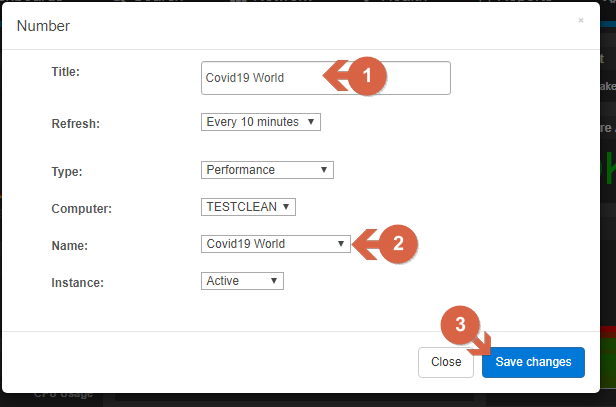
Fig.9: Configuring Tile
The new tile should look similar to the tile below, hopefully with a 6-digit number.
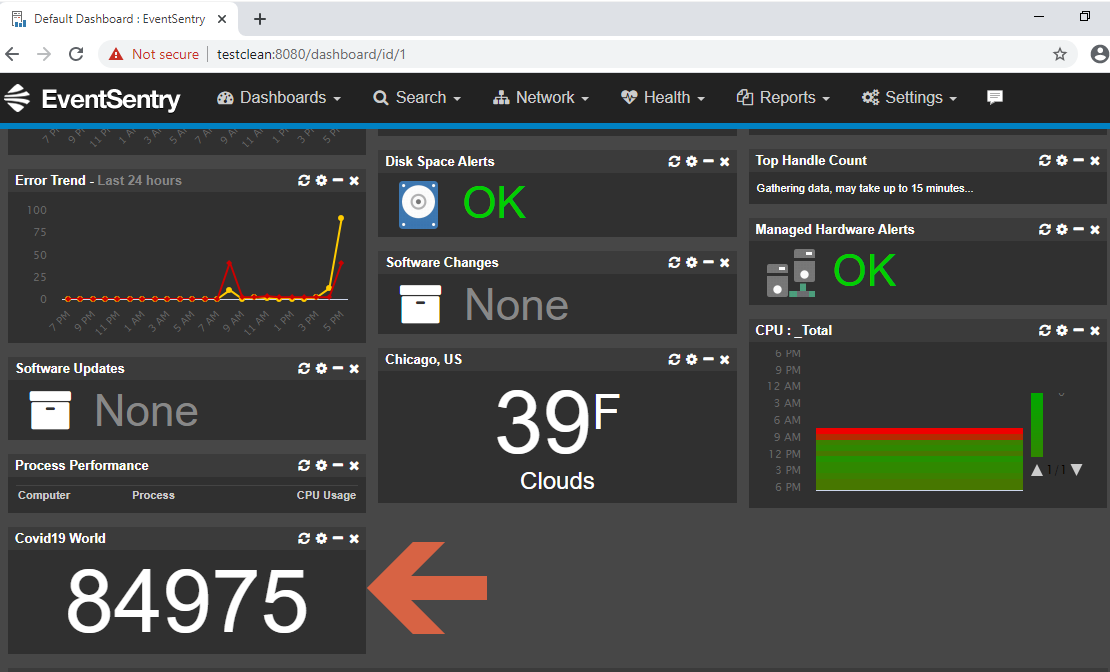
Fig.10: Covid19 WebReports Tile
Creating a dashboard with COVID19 data (Video):
Vid.1: Covid19 Live Status Configuration