Network Monitoring
Download Now Request a demo

Provides unparalleled insight into your network by correlating a number of powerful monitoring components, including ICMP & TCP checks, active & passive SNMP, NetFlow & sFlow traffic analysis, ARP monitoring, switch port mapping and more.
Network / SNMP Monitoring
In addition to monitoring Non-Windows machines with PING and TCP port checks, you can monitor any SNMP-capable device (versions 1, 2c & 3 are supported) such as Linux servers, routers and switches using SNMP. The following information can currently be monitored/collected:
- System Information (OS, platform, serial number)
- Basic Hardware (processor, installed memory, network interfaces)
- Current Uptime
- Mounted disks incl. disk space usage
- Running processes
- Daemon activity & inventory (requires SSH access)
- Any numerical SNMP counter (CPU usage, memory utilization, network bandwidth ...)
- Basic availability with PING
- TCP port availability
In order to minimize the time it takes to detect a problem, EventSentry scans & monitors all remote hosts in parallel, utilizing multiple threads.
Syslog Daemon
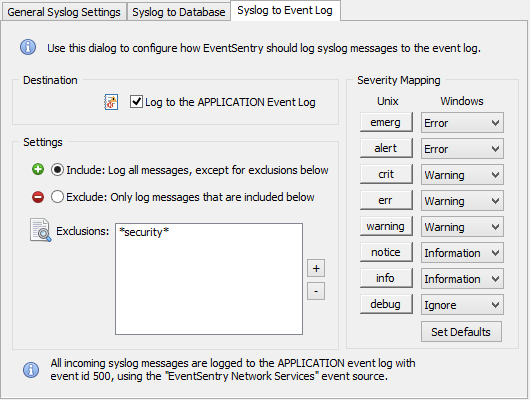
Collect and consolidates Syslog data from any device that supports the Syslog protocol. EventSentry's syslog daemon (UDP and TCP are both supported) can be configured to consolidate incoming Syslog messages to the central database and/or log incoming Syslog messages to the Windows Application event log (Syslog to Event Log). The Syslog daemon can be configured to accept/reject messages based on their content, facility, severity or IP origin.
Using the web-based reporting, you can search across all collected Syslog data from your entire network.
 The syslog protocol is supported by various Unix/Linux flavors (e.g. Linux ©, RedHat ©, SUSE ©, OpenBSD, NetBSD, FreeBSD, Sun © Solaris ©, Apple © OSX 10.x, various Cisco and other high-end network devices).
SNMP Trap Daemon
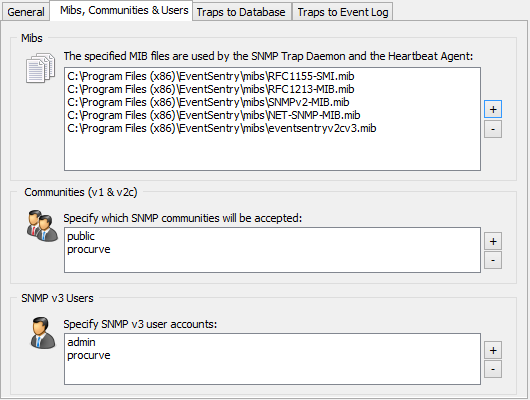
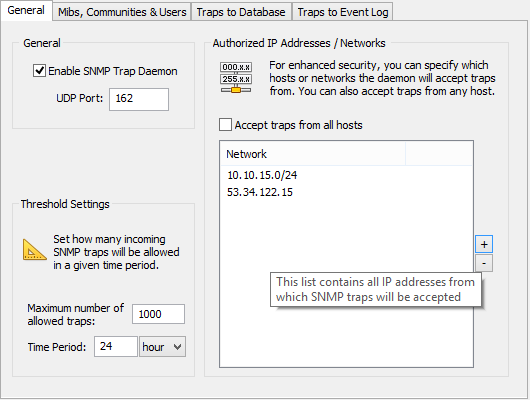
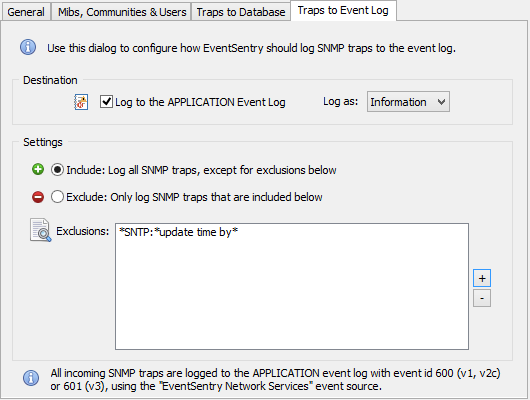
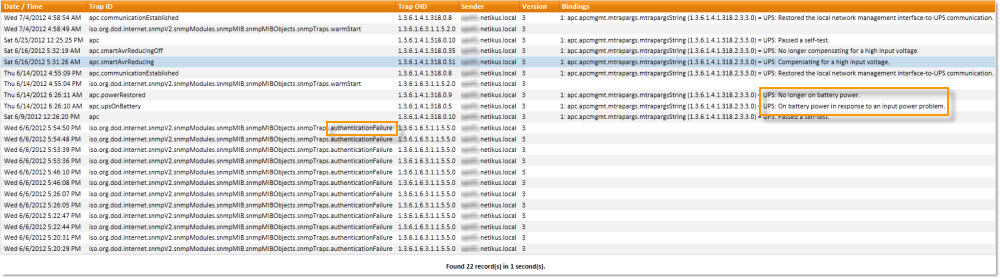
The SNMP trap daemon, part of the network services, logs incoming SNMP traps (v1, v2c and v3 are supported) to the event log and/or consolidates the traps in the central EventSentry database. SNMP traps can be accepted/rejected based on a contained OID or content (payload).
The SNMP trap daemon is easy to configure, and supports both privacy and authentication. For an easy setup, SNMP v3 users can be configured for a single engine ID or multiple engine IDs.
NetFlow
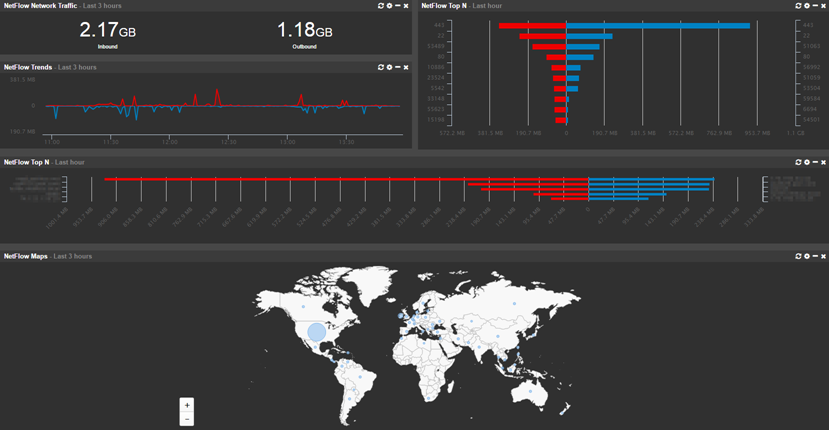
NetFlow is a separately licensed component and supports the collection of NetFlow v1, v5, v9 as well as sFlow flow data. Collecting NetFlow data allows you to see all IP traffic meta data from devices which support NetFlow, such as routers and switches.
EventSentry's unique NetFlow implementation lets you:
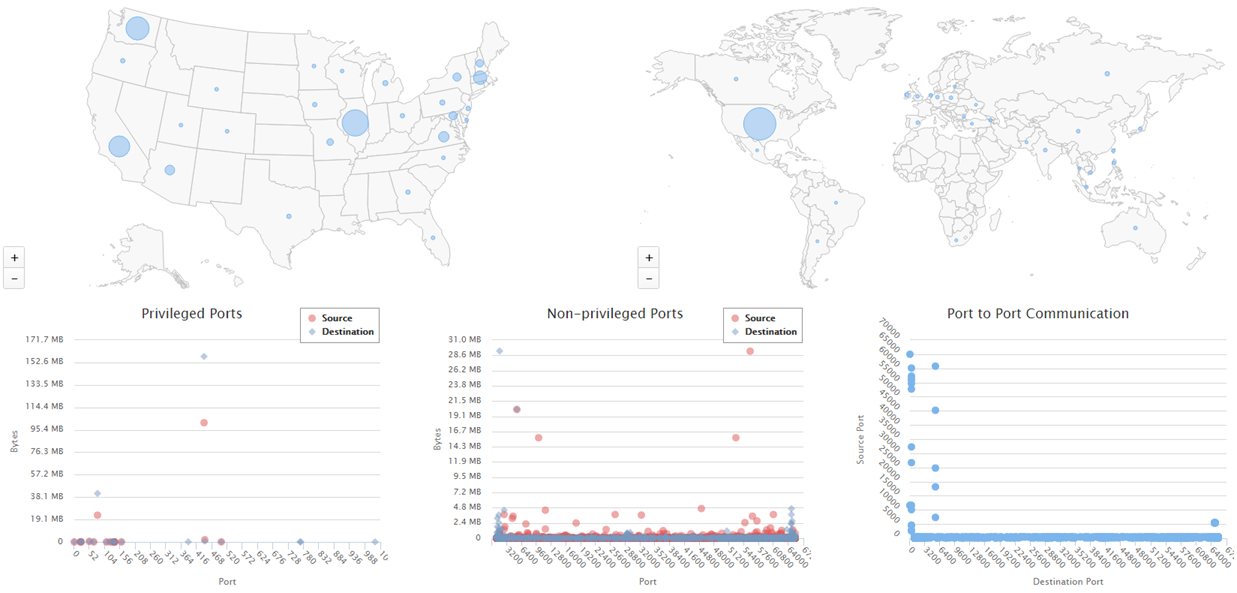
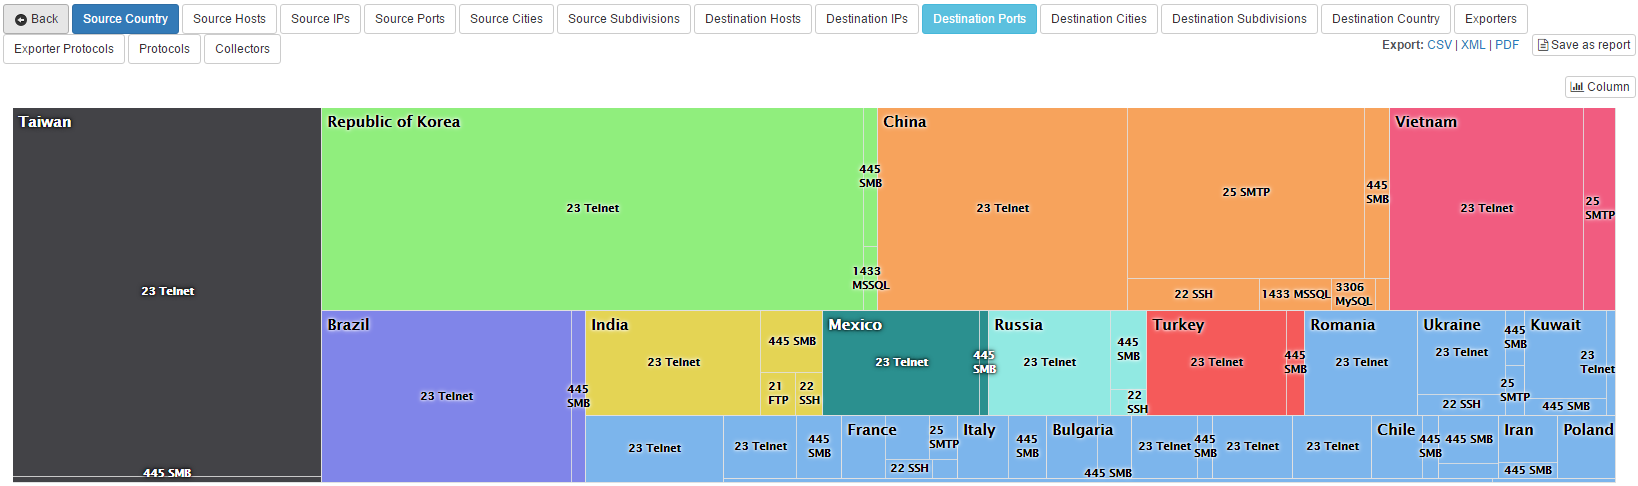
- Visualize all network traffic in a variety of ways and reports
- Analyze network data for forensic investigation
- Utilize network traffic data for troubleshooting purposes
- Map network traffic to geo location
- Correlate network traffic with Active Directory users (requires workstation monitoring)
- Measure bandwidth utilization
Geo Location
EventSentry ships with the GeoLite geo database from MaxMind which does a good job of associating IP addresses with physical locations down to the city level. If you are looking for more accuracy however, then you can also purchase the full geo location database from MaxMind here.
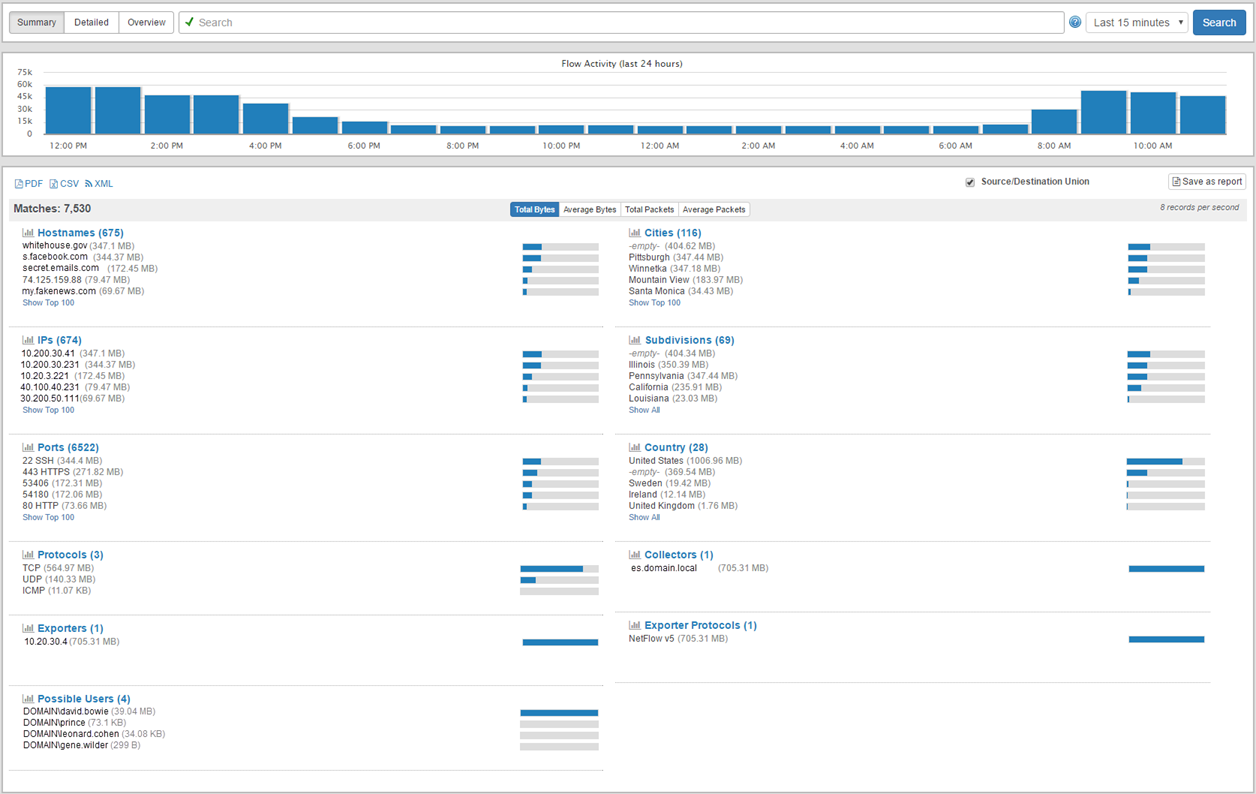
Active Directory User Correlation
A unique feature of EventSentry's NetFlow implementation is the ability to correlate workstation logins with network traffic, making it possible to associate network traffic with individual users. This requires that workstations are monitored with EventSentry and works best when users have a dedicated workstation.
Switch Port Mapper
The SNMP-based switch port mapping component automatically identifies to which switch port a device is connected to without the need to trace cables in the server room. The switch port mapper works automatically for any switch that is monitored with EventSentry, and works on switches of any vendor which support this functionality (download the free SnmpTool to see if your switch is supported).
By correlating MAC addresses with data gathered from other EventSentry features (e.g. ARP monitoring, host inventory), the switch port mapper can not only show the MAC address, but often also show the IP address and/or host name of the connected device, making troubleshooting a breeze!
ARP Monitoring
The ARP watch daemon, part of the network services, actively monitors all network traffic to
- Detect devices added to the network
- Keep track of MAC address usage
- Detect ARP spoof attempts
Notification Methods
Since all heartbeat notifications go through the event log, you can take full advantage of EventSentry's notification types as well as sophisticated event log processing engine. For example, you can notify different recipients based on the type of host that is down, or time of day.
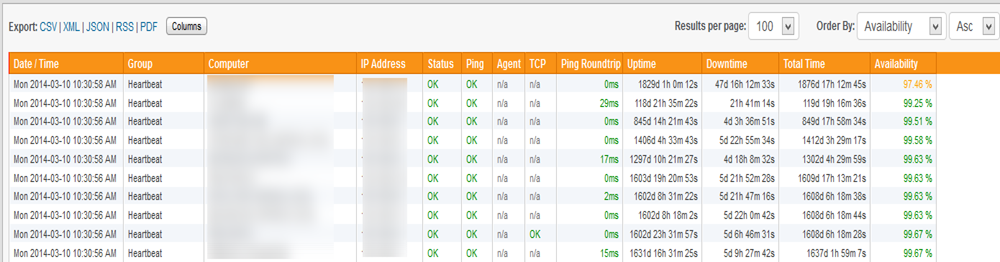
Status and History Reports
In addition to being notified when a host or service go offline (or back online), EventSentry offers a heartbeat status web page that will show you at a glance which hosts and services are currently online or offline. A heartbeat history page will show you a complete history of all status changes. Both the status and history page are either HTML pages constantly update by the agent, or saved to a database where the status and history reports can be viewed through the web reports, which offers additional search features.
Monitoring through PING
You can monitor remote ip hosts by sending fully-customized ICMP packets. This monitoring type offers the following features:
- Configure the amount and size of the ICMP packets to send to the remote host
- Configure the desired success rate (e.g. 50% of packets should be acknowledged)
- Configure the desired average response (e.g. 500ms)
Monitoring HTTP/HTTPS web pages
EventSentry can monitor any HTTP/HTTPS page for availability with the application scheduler and the free CheckURL utility. Be notified when a page's checksum changes and ensure that a given content does (or does not) appear on the page.
Monitoring database availability
EventSentry can monitor any database which offers ODBC drivers for availability with the application scheduler and the free CheckDB utility. The utility will connect to the database, authenticate, and optionally run a SQL statement and check its return code.
Monitoring network services through TCP
In addition to or instead of PING monitoring you can verify that remote services listening on TCP ports (e.g. POP3, HTTP, SMTP etc.) are active. You can specify multiple ports when monitoring a host.
Monitoring EventSentry Agents
For computers running Windows and the EventSentry agents, monitoring the EventSentry agents will ensure that your servers and workstations are being monitored. This feature will ensure that the EventSentry service is in a running state on the monitored computers.
Ping Latency
Ping response times can be recorded in the database and visualized through the web reports.
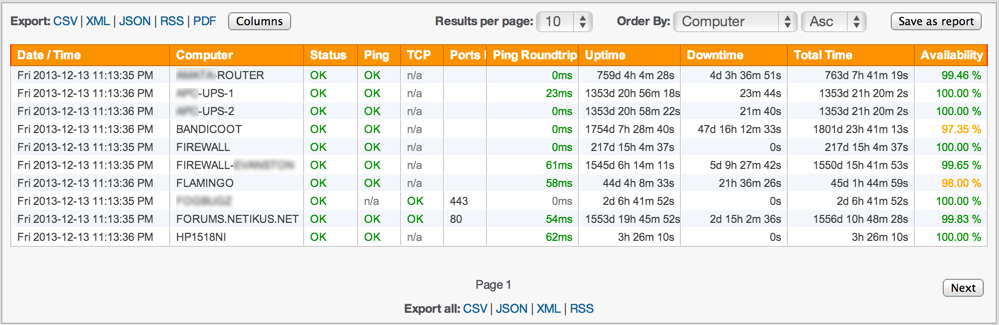
Availability
The heartbeat availability page shows you the uptime of all monitored hosts (based on PING) in percent, useful when you need to fulfill service level agreements (SLA) or simply to see which hosts are most reliable. The report includes the total uptime, total downtime, total time monitored and the calculated uptime in percent.
Advanced Features
- Hosts in a heartbeat-group can be flagged as a router in order to suppress duplicate heartbeat alerts
- Only check agents or TCP ports when a PING was successful to avoid duplicate notifications
- Immediately repeat a check that failed to avoid receiving notifications on temporary outages
- Require X failed checks to trigger an error in the event log
- Maintenance Schedules allow you to suppress alerts during scheduled maintenance periods
 Event Log Monitoring
 Reporting
 Health Monitoring
 Process Monitoring
 Compliance
 ADMonitor
 Management
 Log File Monitoring
 Network Monitoring
 Environment
 Notifications
 Log Consolidation
 Full Feature List