How do I automatically restart services or processes based on resource usage?
EventSentry can be configured to restart services based on their resource usage. For example, when a service uses more than the specified amount of memory, handles or CPU, a service restart can be triggered.
Steps:
- Creating a Performance Monitoring Package
- Configuring the Performance Monitoring Package
- Creating and Configuring an Action.
- Creating and Configuring Event Log Filter to trigger the Action
- Saving Configuration
Creating a Performance Monitoring Package
First create a Performance Monitoring package to monitor the specific service and generate an alert based on the resource usage. In this example the Printer Spooler service will be used.
In the management console, right-click on System Health (1) and click on Add Package (2). Enter the desired name (Print Spool Performance will be used for this example) (3). right-click on the package and then click on Add (4) and select Performance / SNMP (5).
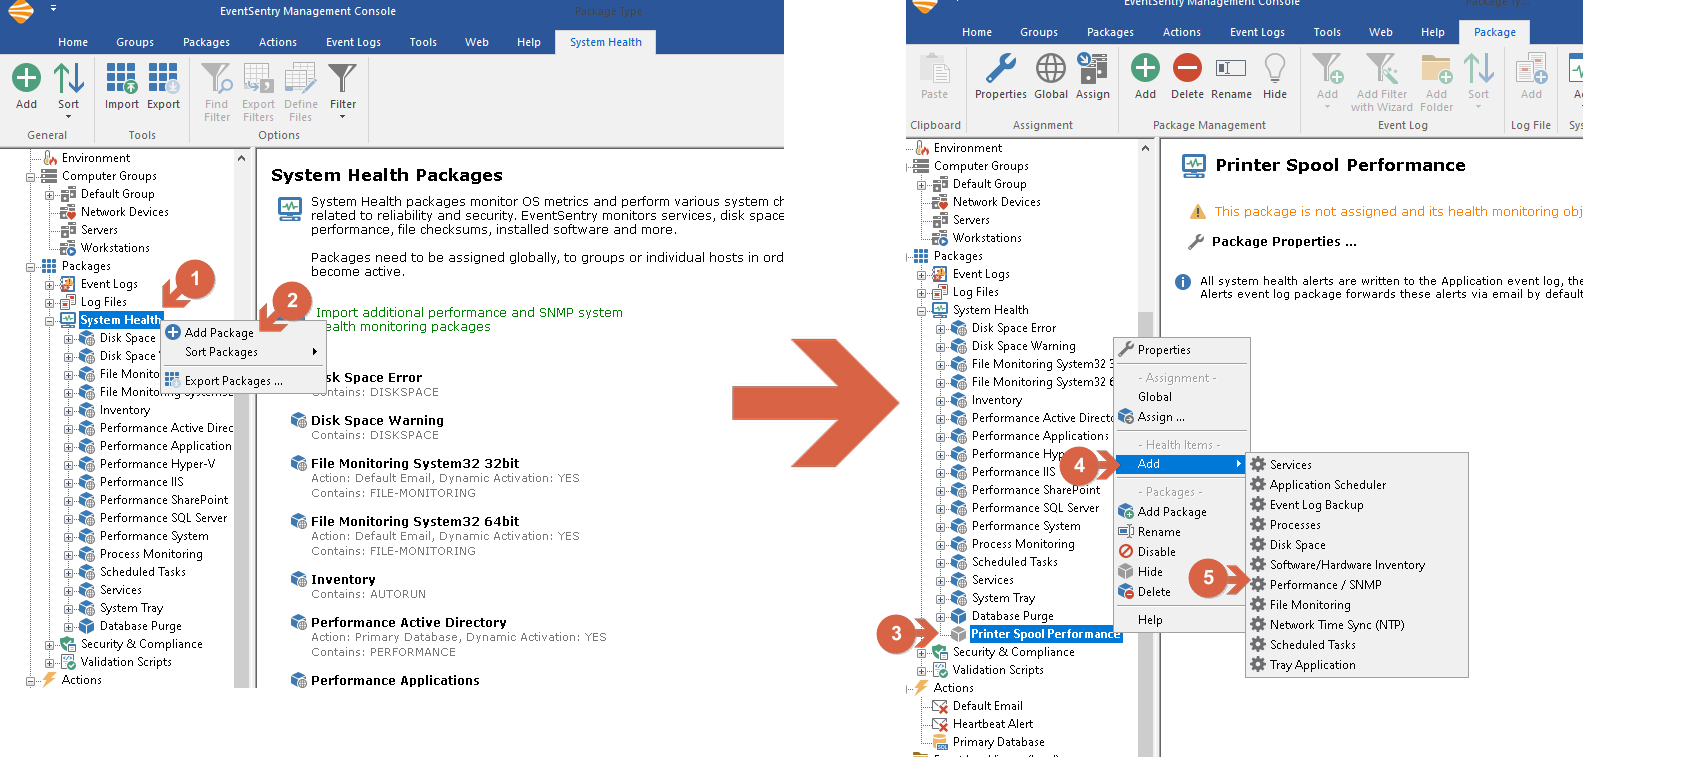
Creating a new Performance Monitoring Package
Configuring a Performance Monitoring Package
Adding process to monitor
From the new package that was just created, click on "+" to add a Performance Monitoring object (1). Specify the monitoring frequency, for example 30 seconds (2) and enter a name for this performance monitoring object (e.g. "Printer Spooler Memory") (3). For the process name make sure that Windows Counter is selected, and specify Process(process_name)\Working Set, where process_name is the process executable file without ".exe". (To determine the process for a given service, simply view the properties of the services in the “Services” or “View local services” application and look for the “Path to executable” field. New versions of Windows also show a list of all services in task manager. The name of the instance is the process name without the .exe extension, spoolsv in this case) (4) After specifying the process name at the bottom, live information should start being displayed in the preview area on the bottom (5).

Configuring a new Performance Monitoring Package
Setting up alerts
Now that we are successfully tracking the memory usage of the spooler service, we need to setup a hard limit in order to trigger an event when that limit is exceeded. Click the “Alert” tab (1) and make sure that Enable check box is set and the severity set to Warning (2). For this example, we are setting the memory hard limit to 100 MB (in bytes) for 15 minutes, and specifying to generate 1 alert per hour ("Enable Repeat alerts at an interval of 1 hour") (3). Click on OK when finished (4).

Specifying the alert limit for the performance counter
Creating and Configuring an Action
With the package created and configured, the next step is to create an Action. From the configuration tree, right click on Actions (1) and select Add Action (2). Enter desired action name (3) and select Service / Process as the action type (4) and click on OK (5). At the next dialog select Control Service (6) and under Service Options specify the service name (Spooler in this example) (7). Select Restart for the "Action to perform".
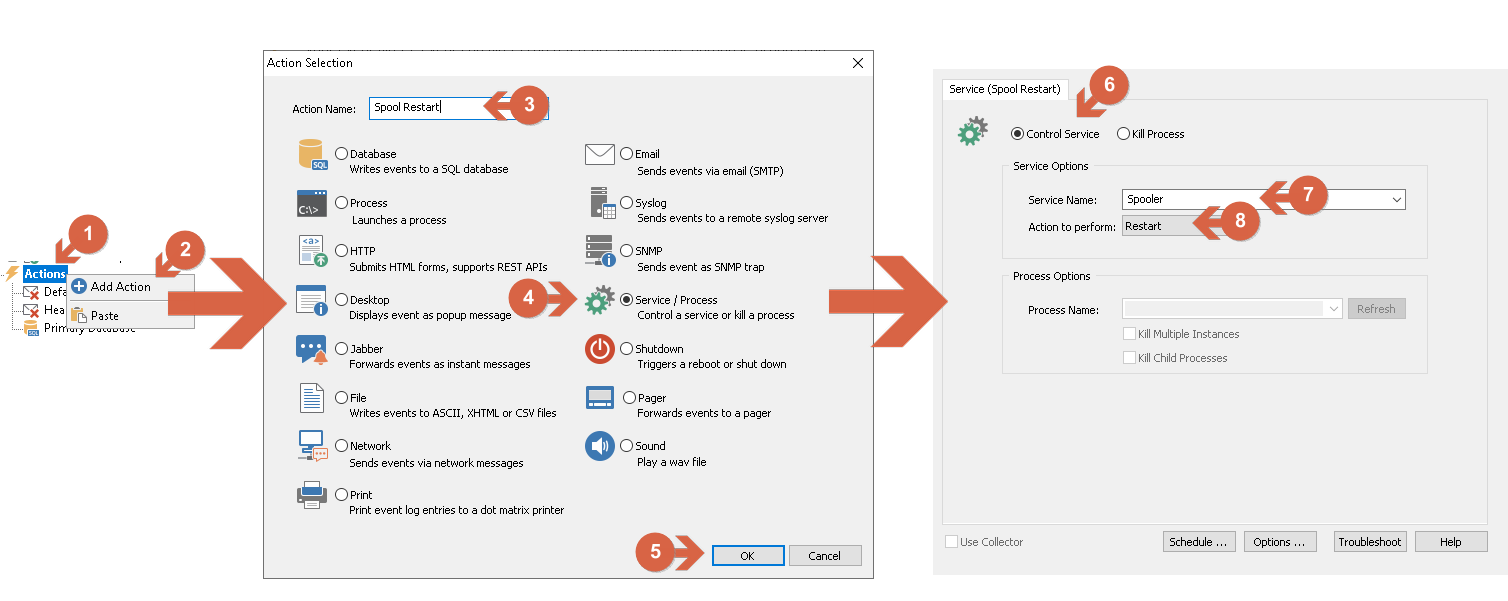
Creating and Configuring an Action
Creating and Configuring Event Log Filter to trigger the Action
At this point EventSentry will generate an alert when the memory usage of the spooler service exceeds 100 Mb and we have an action that can trigger a service restart. The last component required is a filter that will trigger the action to restart the service.
In the configuration tree, right-click Event Logs under Packages (1) and click on Add Package (2). Enter the name for the package (we used Printer Spooler Memory for this example). (3) Right-click on the package and select Add Filter (4). In the filter configuration window, under actions, click on + symbol and make sure to add the action that was just created (Spooler Restart in this example). (5) Make sure that just Application and Warning check-boxes are selected (6) and set the filter settings to Include (7). The details should be: (8)
Event Source: EventSentry
Category: Performance Monitoring
Event ID: 12104
Under Content Filter & Notes click on + symbol and select Insertion String Match as the text match type. Select insertion string 5 and enter Print Spool Performance (That should match the System Health package name we created at the beginning of this guide). Click on + again and add another entry, this time Insertion String 1 with a value of *Working Set* (9).
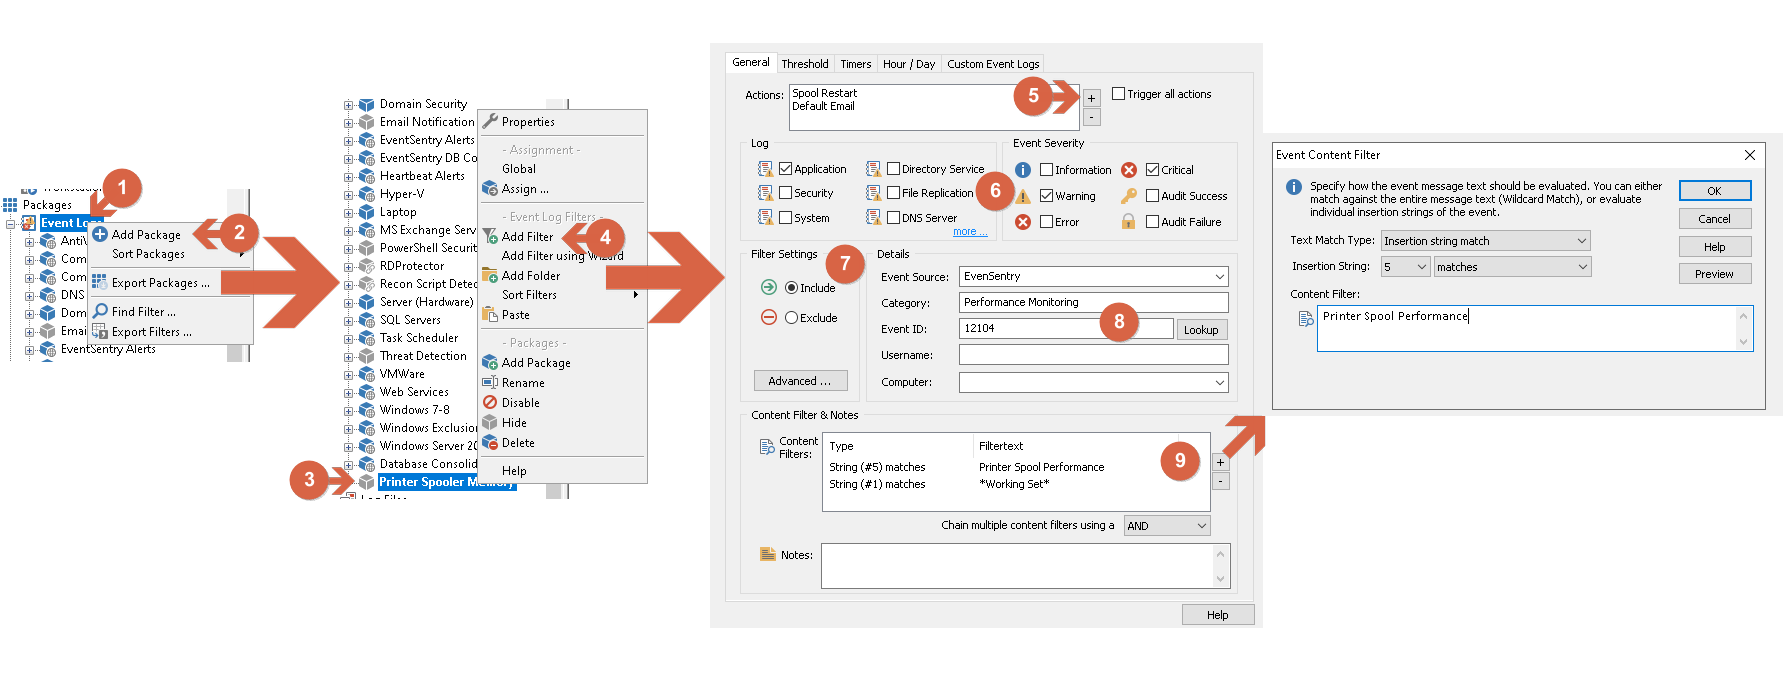
Creating and Configuring Event Log Filter to trigger the Action
Saving Configuration
From the top menu click Home (1) and either click the "Save" or "Save & Deploy" icon (2). It may be necessary to manually push the configuration if the collector is not being used. Clients usually pickup the new configuration in a couple of minutes.
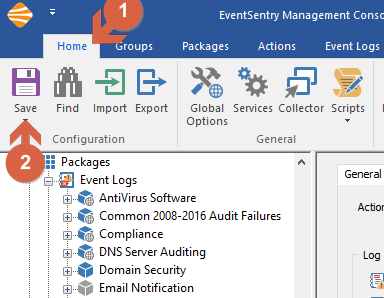
Save Configuration
Related articles: BLOG