Custom Logon Failure dashboard tile using Event ID 4625
Article ID: 464
Category: Web Reports
Applies to: 4.2 and later
Updated: 2022-01-19
The EventSentry dashboard includes the generic "Search" tile, which can be used to display data from any page in the web reports, e.g. event log data. The Search tile also offers the ability to extract select data (strings) from events and display them in custom columns. This method can be applied to any type of event logged to the event log.
Here we will extract the following data from 4625 events:
- Logon Type
- Security ID
- Username
- Failure Reason
- Process
- Remote Host
- Remote IP
Follow the steps below to setup the new tile:
- Navigate to any dashboard and click the green plus icon to bring up the tile selection dialog.
- There, select the "History" tab and add the "Search" tile.
- Position the tile and click the gear icon of the tile to edit its properties
- Make sure that the tile type is "Event Log" (the default)
- Only select the "Computer" and "Message" columns
- Specify the following query: log:Security AND type:"Audit Failure" AND id:4625
- In the Regex Formatter, select "Message" and specify the following Regex pattern:
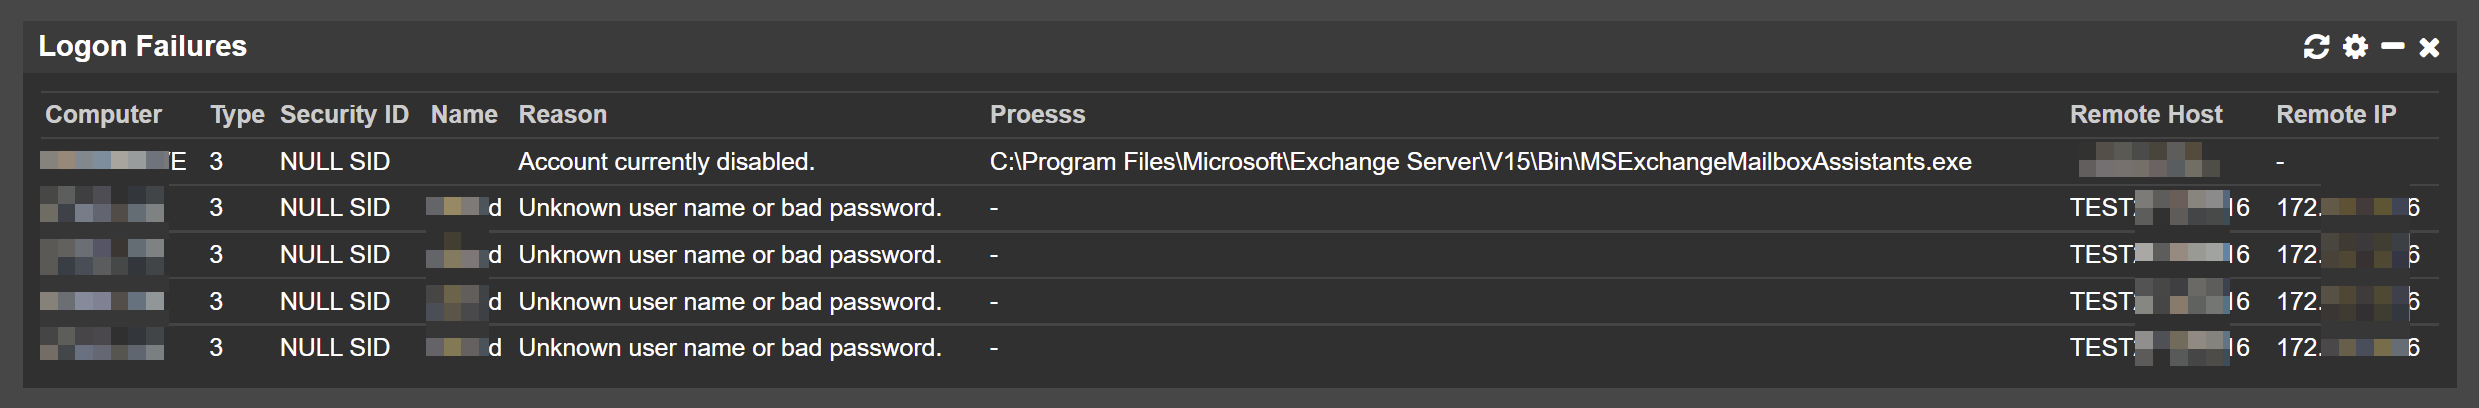
Logon\sType\:\s(.+) .* .* .*Security\sID\:(.+) .*Account\sName\:(.+) .* .* .* .*Failure\sReason\:(.+) .* .* .* .* .* .*Caller\sProcess\sName\:\s(.+) .* .* .*Workstation\sName\:\s(.+) .*Source\sNetwork\sAddress\:\s(.+) - Specify the following "Group Headers": Type,Security ID,Name,Reason,Proesss,Remote Host,Remote IP
When configured properly and data present, the dashboard tile should look similar to what is shown below: