EventSentry v2.92
The main new features in version 2.92 are:
- Network Services component
- Embedded performance / environment charts
- HTTP action
- Hardware Inventory & Monitoring
Please see the release history or the documentation for a complete list of all bug fixes and new features.
Network Services
The network services component is the main new feature in EventSentry, and adds powerful functionality – the ability to receive SNMP traps – to our monitoring solution. Any network device that supports SNMP v1, v2c or v3 can be configured to send traps to EventSentry, which can then either forward the trap details via email, or log them to the database for archival and searching purposes.
Unlike other products, configuring the snmp trap daemon is easy and uncomplicated. Simply specify any MIBs you want to load, configure any SNMP communities and/or v3 users, and (optionally) setup text filters to include/exclude specific traps based on their content.
The network services component now also includes the syslog daemon, which was previously embedded in the EventSentry agent. This change includes higher availability, since the network services will cache incoming (snmp and/or syslog) packets if the main database is temporarily unavailable.
Another new “feature” is the ability to run the network services daemon on Linux and OS X operating systems. We developed all code in the network services to run on multiple platforms, and will continue to do so with all upcoming new components in EventSentry. Cross-platform functionality is still experimental, and as such we don’t currently have an installer for non-Windows operating systems. If you are interested in running the network services daemon on Linux or OS X, then please send a request to our support team.
Visualizing performance and environment data with embedded charts
Performance monitoring and alerts have always been a popular and useful feature in EventSentry, but a numerical alert can only convey so much information. If an alert shows that the CPU usage has been exceeded, say 80% over a time period of 10 minutes, then it is often helpful to see the performance data in a chart. This would show whether the CPU usage spiked during the beginning of the 10-minute interval and is back in an acceptable range, or whether the CPU usage has been mostly constant. In the past, you would need to review the performance history through the web-based reporting (which is still an option and desirable for long-term analysis), but starting with v2.92 email alerts can now include an embedded chart which shows exact performance information from the monitored time interval.
For example, if your performance alert is configured to generate an alert when the CPU usage exceeds 90% for more than 30 minutes, then you can receive an attachment in addition to the text alert, showing performance data from the last 30 minutes.
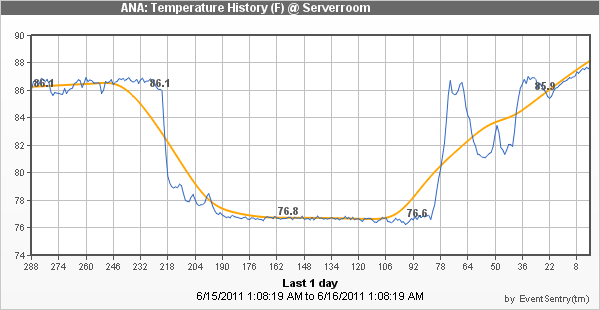
 Embedded charts are also included with temperature and/or humidity environment alerts, an example chart is shown below:
To better interact with web-based solutions like iService, EventSentry now includes a new notification type: HTTP. With the new HTTP action, you can submit event data to any HTTP or HTTPS-based form, making it extremely easy and reliable to interact with web-based systems (e.g. ticketing systems). Setting up a HTTP action is easy: Simply provide the URL, authentication and specify any event fields that you want to submit.
Hardware Inventory & Monitoring
Also new are network link speed monitoring, which can alert you when the NIC speed changes. This can be useful if a host is accidentally connected to a different switch, or simply to inventory all network connections.
EventSentry also monitors connected USB storage devices and can alert you when a drive is added or removed. The S.M.A.R.T. status of drives is also monitored, and junction points are now taken into consideration when evaluating the disk space of a logical drive. Also new is a “physical disks” section in the web reports.
iPhone App
Why yes, there is an app for that! How convenient would it be to review the health status of all your monitored hosts from your iPhone – including health statistics, hardware details and more?
Dream no more, with the EventSentry iPhone app you can review the status of all your servers from your phone (so long as it has access to your web reports of course).
Upon launch the app shows a searchable list of all monitored hosts and their respective health status. Tapping on a host will show detailed information, such as performance data, hardware information and more. Please take a look at the official iTunes page for the EventSentry app for more information and screenshots.
If you are an Android user then there is no reason to worry, an Android version of the EventSentry Mobile app is planned later this year.
Again, please see the version history for a complete list of features and fixes in v2.92.