3-2-1-Go! EventSentry 3.2.1 is out!

I am e-x-c-i-t-e-d to announce the availability of EventSentry v3.2 and tell you more about the new features and improvements. So, if you’re looking for a little bit more than the release notes then read on!

Collector
The biggest new feature in 3.2 is the collector, a new central component which enables a 3-tier architecture in EventSentry. Traditionally, the EventSentry agents have been communicating directly with email servers, databases and other services. While this usually worked well – and is still desirable in many setups – it does impose a limitation in some scenarios:

  • The SMTP server cannot be configured to allow relaying and/or accepting SMTP connections from remote clients
  • The central database cannot be configured to allow connections from remote clients
  • Agents need to communicate over an insecure medium like the Internet
  • Installing ODBC drivers is not an option
  • Remote agents communicate over unreliable network connections (e.g. satellite, laptops, …)

The collector addresses the above limitations by acting similar to a proxy between the remote agents and the service (e.g. database). In a nutshell, it provides the following benefits:

  • Agents only communicate with the collector over a single port
  • All traffic can be encrypted and compressed
  • Database connection details do not need to be stored on the agents anymore
  • All collected data is cached on the agents if and while the collector is unreachable

Whether you will need the collector or not will largely depend on your network setup. If all of your hosts are in the same data center and/or the same LAN, the collector may provide little benefit. If you are a MSP and monitoring remote sites and laptops however, then the collector is probably what you have been waiting for!

When upgrading (or installing from scratch), the post-installer configuration assistant will ask you whether you are interested in enabling the collector.

Collector Status
Collector Status in maintenance menu

If you are installing from scratch, then enabling the collector during the installation is all you need to do. When upgrading, an additional step is required – an action needs to be configured to use the collector. While the collector service is installed & started during the upgrade when selected, it will not enable any of the existing actions to use the collector. As such, if you want to route data for a specific action through the collector, that needs to be configured. Simply edit the action and click the “Use Collector” check box on the bottom left and push the configuration.

In version 3.2.1, the following actions can be routed through the collector:

  • Database
  • Email (SMTP)
  • Syslog
  • Text File

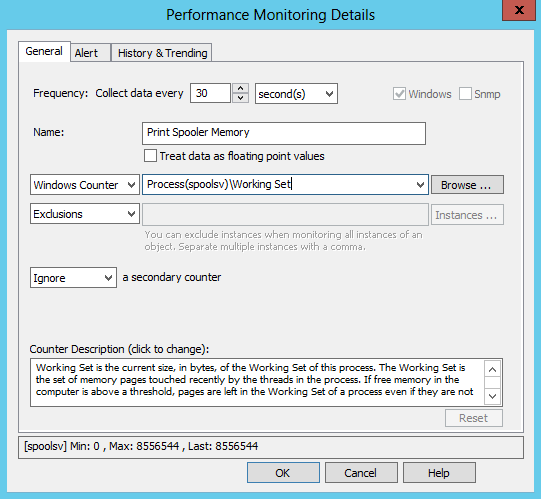
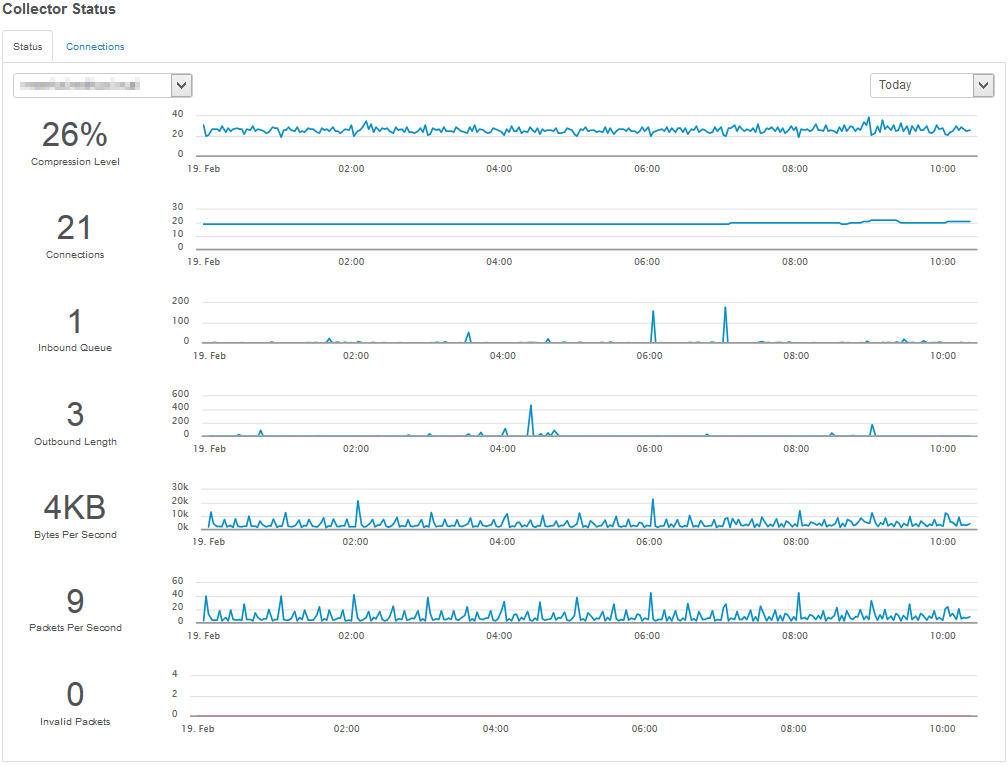
Since the collector, when enabled, is a critical component, we recommend monitoring the collector stats either through the collector status page (Maintenance -> Collector Status) or by adding the collector status tile to one of your dashboards.

There is one other advantage the collector can bring when routing emails through it:

  • Emails from multiple hosts can be grouped together (if the action polling interval is sufficiently high)
  • Action thresholds can now be applied centrally

Both features can help reduce the number of emails you receive from EventSentry, usually a popular thing to do!

Compliance Modules
EventSentry has always included the compliance tracking components which monitor and interpret Windows security events. Compliance tracking provides process, console, account management and other tracking reports. While popular and extremely useful, the compliance reports themselves don’t tell the user which particular compliance requirement they address.

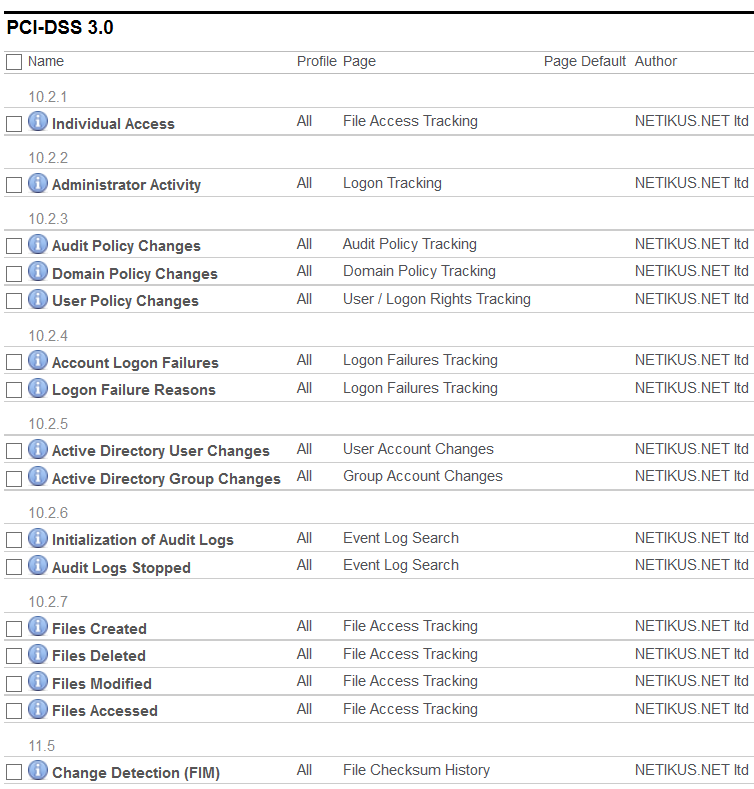
Say Hello to the new compliance modules, which provide detailed, out-of-the-box reports for:

  • PCI-DSS
  • FISMA
  • HIPAA
  • GLBA
  • Sarbanes Oxley

Once a compliance module is enabled, it will install a number of reports that pertain to the specific compliance requirement that was enabled. Every report will be associated with a specific control (e.g. PCI 10.2.2) and allow you to setup a required review, job and more.

PCI Compliance Reports
Example of PCI compliance reports

(Network) Switch Mapping
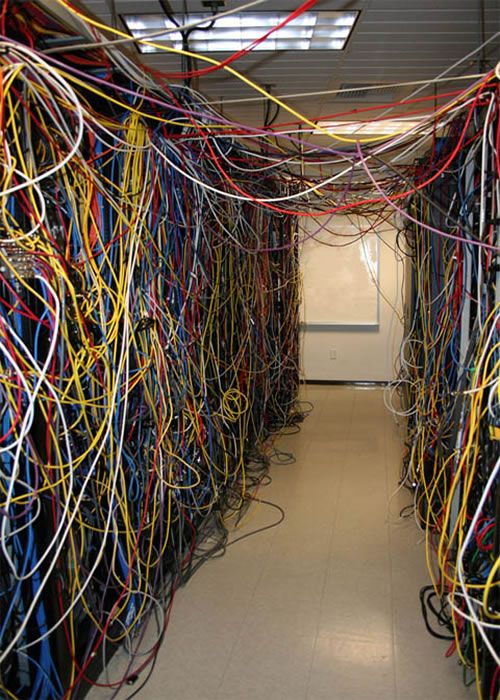
Finding the port on a switch to which a server, workstation or network device is connected is often a time-consuming and annoying process for most SysAdmins. Starting with version 3.2, EventSentry tries to ease that pain by showing exactly to which switch – and port – a host is connected to. All you need to do is add the switch to the EventSentry configuration, make sure that it can be monitored via SNMP and that it provides the MAC to port mappings via SNMP (OID 1.3.6.1.2.1.17.4.3.1.2 – iso.identified-organization.dod.internet.mgmt.mib-2.bridge.dot1dTp.dot1dTpFdbTable.dot1dTpFdbEntry.dot1dTpFdbPort). This feature should work well with all mainstream managed switched, and we haven’t run into a switch yet where this feature wasn’t provided or did not work.

Server Room Cables
Server Room Cables

Once EventSentry pulls the MAC to Port mappings, you will be able to retrieve the collected information in two ways:

  • Through the Inventory – Switch page, which will show all monitored switches and connected devices
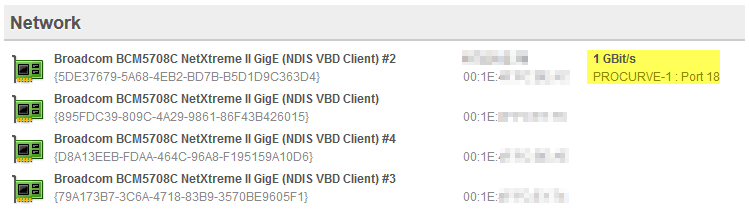
  • Through the Inventory – Host page. If the switch port can be detected, it will be displayed next to the IP address of the network card

Since switches only provide MAC addresses, EventSentry attempts to map MAC addresses to host names and IP addresses by analyzing the hardware inventory details as well as the ARP status table when available. As such, it is recommended to enable the ARP component of the network services if the results on your switch inventory page are incomplete.

EventSentry Switch Port Indicator

Web Reports Improvements
Starting with a visual overhaul of the interface, the web reports also received an internal overhaul to improve overall performance, especially when using multiple profiles. The performance trends page can now display multiple charts on a single page, and the host inventory page now shows the highest supported USB version on that host.

Managing multiple reports is easier now through the ability to bulk-edit reporting settings. Reports can now also be saved to a folder instead of being emailed.

Finally, the web reports are now also officially available in 6 additional languages: French, Spanish, Polish, Portuguese, Dutch and Italian. This brings the total number of supported languages in the web reports to 9!

Management Console Improvements
Improvements in the management console pertain mostly to remote update and computer management. Hosts can now be imported from a network scan, which is particularly useful when managing network devices which often don’t show up in Active Directory. The network scan is multi-threaded and can scan a class C subnet in a few seconds and even supports checking TCP ports for hosts which have ICMP disabled.

Remote update can now store the result of every activity in CSV file(s), and output from remote update can be toggled with the context menu to apply remote update actions to a sub-set of hosts easily.

Also new is the ability to export all event log filters to a CSV file allowing you to analyze the results in your favorite spreadsheet application to identify issues, duplicates etc.

That’s all folks. Time to get cracking on 3.3!

Automatically restarting services or processes based on resource usage

In the ideal world, every software we install on our servers and workstations uses as few resources as possible, doesn’t have memory or handle leaks and never crashes.

But in reality, Sysadmins often have to deal with temperamental business-critical third-party applications (or in-house developed) which exhibit a number of issues, including:

  • Memory Leak: The application keeps eating away at the available memory like a chubby caterpillar chewing on a leaf
  • Handle Leak: The application continuously increases its handle count, which takes away from kernel memory over time
  • CPU Spike: The application uses all CPU time of one or more cores

When one of these issues is encountered, a manual application (or service) restart, along with a potential bug report, is usually the only solution. Consequently, keeping a close eye on both Windows and third-party software – especially on servers – is considered good practice. But even better than looking is being proactive of course, for example by automatically restarting a service which uses too much memory or CPU.

Frozen Leak

This is where EventSentry comes in. EventSentry doesn’t just analyze metrics available through Windows performance counters (e.g. CPU usage, handle or memory count of a process.), it also allows you to take corrective action based on granular rule sets. This ensures that all active applications are behaving nicely by staying within pre-defined performance boundaries.

To get there, we utilize 3 features in EventSentry:

1. Performance Monitoring
2. Event Log monitoring
3. Service restart or process action

Since examples usually work best, I will outline the steps required to restart the printer spooler service if it uses more than 100 Mb of RAM. This is for illustration purposes only, I’m not suggesting that the printer spooler service should not use more than 100 Mb of RAM.

Performance Monitoring
Application performance monitoring is already setup out-of-the-box via the “Performance Applications” System Health package. This package, by default, is assigned to all hosts and collects key application metrics in the EventSentry database. Since this package is generic and captures all processes (without generating alerts), we’ll create a separate package that will only monitor the spooler service.

Unless you resort to scripting, it is unfortunately not easily possible to automatically link process names (as they are reported by the Windows performance monitoring subsystem) to a service name. As such, we will need to first find out the process of the service we are monitoring and then monitor only that instance of the performance counter. To determine the process for a given service, simply view the properties of the services in the “Services” or “View local services” application and look for the “Path to executable” field. New versions of Windows also show a list of all services in task manager and let you jump to the process by clicking on “Go to details”. The name of the instance is the process name without the .exe extension, spoolsv in this case.

The next step is to create a new System Health package and add a performance object. Select the System Health packages container, click “Add package” from the ribbon and enter a suitable name. Select the newly created package and add the performance object to the package. Now select the “Performance” object and click the “+” icon to add a new performance object to monitor. Every performance object in EventSentry requires at least a name (to describe the counter) as well as the actual Windows performance counter. The respective performance counter for monitoring the memory usage of a process is Process(*)\Working Set, and since we are only interested in the spooler process we will use of the Process(spoolsv)\Working Set performance counter. When you are done, the dialog should look similar to what is shown below:

Performance Counter Setup
Specifying the performance counter to monitor the memory usage of the spooler process

The default frequency is 10 seconds which works well for most counters, but you can increase this frequency for counters which change only minimally over the short term (as is usually the case for memory usage and handle count), so we will use 30 seconds in this case.

Now that we are successfully tracking the memory usage of the spooler service, we need to setup a hard limit in order to get an event when that limit is exceeded. Click on the “Alert” tab and configure the dialog as shown below:

Specifying the alert limit for the performance counter

We are only concerned with the top section of the dialog, please see the documentation for more details on the “Notify at most …” and below options.

The last step in this section is to assign the package: Select the package, click “Assign” in the ribbon and assign the package to a computer or group. EventSentry is now tracking the memory usage of the spoolsv process and will log a warning event if the memory usage exceeds 100 Mb.

Action
EventSentry uses actions to send emails, toggle services or start processes. Since we want to restart the spooler service, we’ll create a Service action. Select the “Actions” container and click the “Add” button. Select the “Service” action type and assign it a descriptive name, e.g. “Restart Print Spooler Service”.

The configuration of this action is probably the most simple in this tutorial – just specify the service name and the desired action as shown below:

Specifying the service to be restarted

Connecting the dots: Event Log Filter
We’re monitoring the memory usage of the spooler now and have an action which can restart the spooler service, but how do we connect the two? You probably guessed it – with an event log filter. Event Log filters allow you to connect an event (e.g. memory usage is too high) with an action (e.g. restart spooler service).

We’ll create an event log filter which will look for the exact event that is being logged when the memory usage of our performance counter exceeds 100 Mb, and trigger the service restart action.

Similar to what we did with the system health package, right-click the “Event Log Packages” container (or use the ribbon) to create a new event log package and assign it to the computer(s) and or group(s) in question.

Then, add a new INCLUDE filter to the package. Alternatively you can also click the “Alerts” button while the performance object is selected to go through a wizard. Either way, the filter should look like the screenshot below:

Specifying the event properties which will trigger the service restart action

Now, when the performance monitor writes event id 12104 with the above properties, EventSentry will trigger the “Restart Print Spooler Service” action which should reset the memory usage of the process. As an added bonus, an email is also fired off so that the operator knows that EventSentry took the corrective action.

Note: Don’t forget to push the configuration to any remote hosts if necessary.

Now sit back and relax knowing that another thing is taken care of for you.