EventSentry v3.5 continues to increase visibility into networks with additional vantage points, making it easier for EventSentry users to reduce their attack surface as well as discover anomalies.
Process & Network Activity Tracking
One major focus of this release is process network activity, an important component in any monitoring strategy. Do you know which applications listen for incoming connections on your monitored machines – or when a new process suddenly starts accepting incoming traffic? Do you know which processes perform outgoing network connections, and to where? How much data are they transferring?

To help you (and possibly your overzealous auditors) answer these questions, EventSentry v3.5 takes the existing process tracking functionality to the next level by integrating with Sysmon and showing processes with active or listening network connections. With EventSentry deployed you can now see:
- Complete Process Details (start & stop times, duration, caller, PID)
- Process checksum
- Process command line
- All processes listening for incoming connections
- All active processes
- Network activity initiated by a process (Figure 1, requires Sysmon)
- Correlation with EventSentry NetFlow (Figure 2, requires NetFlow component)
This means that you can easily see which network connections a host establishes if you have Sysmon installed, and can even correlate that information with the EventSentry NetFlow component with just a click (see below). This information is invaluable for forensics and troubleshooting alike.

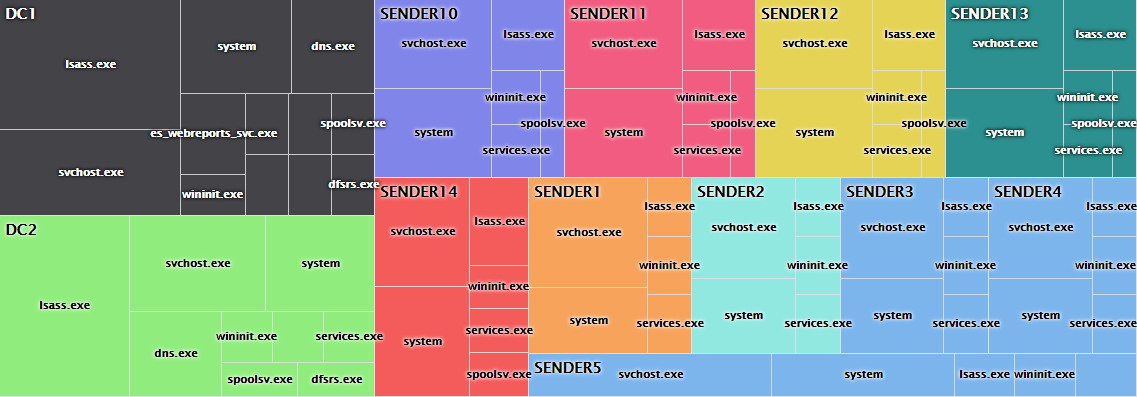
But even without Sysmon, EventSentry can now show you every open TCP port on a monitored machine (optionally all active connections as well), making it easy to discover rogue services on a network – even if they are blocked by the firewall. Figure 3 below shows all active processes which are listening for incoming connections, grouped by host.

Registry Tracking
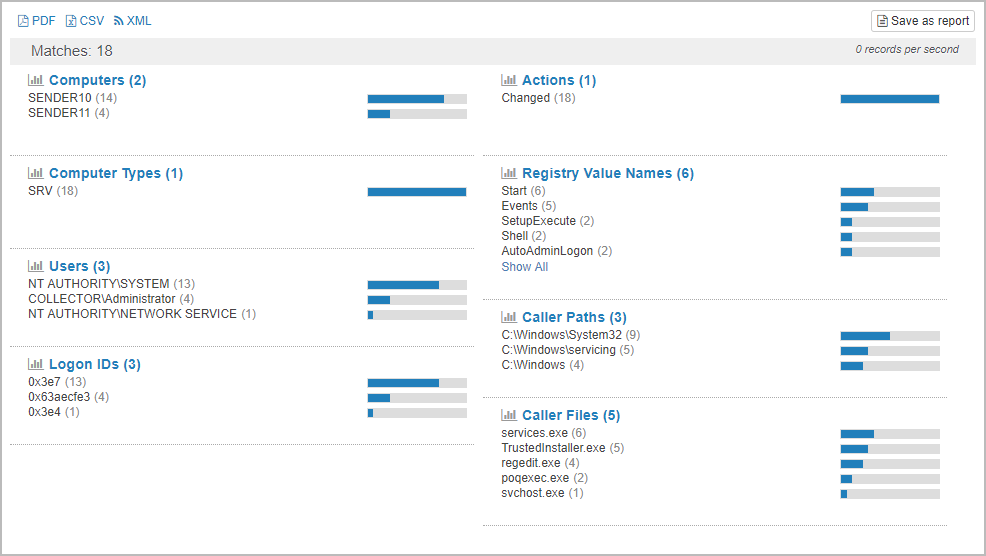
A new member in the compliance tracking features family is registry tracking. Similar to file access tracking, it normalizes all registry audit events on a monitored machine, making it much easier to report on the registry activity and changes. Configuring registry tracking to work with existing registry auditing is incredibly easy and can be enabled in 60 seconds if the proper audit settings are already in place. The screen shots below show a list of recent registry activity as well as the details of changes:


Tags
Users managing a large number of hosts will appreciate the new “Tags” feature which addresses a shortcoming with the existing flat group structure. Tags allow groups or hosts to be tagged with keywords (e.g. production, staging, development). The created tags can then be used in the web reports (e.g. Show me disk space from all hosts tagged with “development”) and for dynamic package assignments.
FIM
The file checksum monitoring component received a few enhancements to help reduce noise while also adding new functionality.
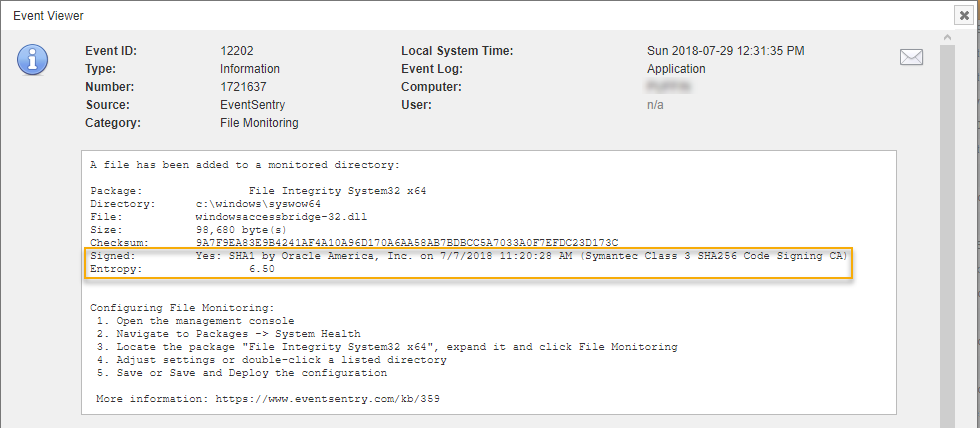
FIM can now verify the digital signature of executable files and optionally suppress alerts if a file is digitally signed – think Windows updates. This can reduce the number of alerts you get significantly and thus make the remaining alerts more meaningful. The digital signature status can also be displayed in the web reports as a new column.
FIM can also calculate the entropy (essentially a measure of randomness) of files with a scale from 0 to 10, with 10 being the maximum of a completely random file. This is useful for Ransomware detection, since encrypted (and compressed files as well) files have a higher entropy than regular files. Combined with a threshold filter this can detect when a large number of encrypted files are suddenly being processed in a given directory and thus indicate a Ransomware infection.

We also replaced the existing SHA-256 checksum algorithm with a faster version in 3.5 which should result in a lower CPU utilization on systems which need to calculate a large number of checksums.
Disk Space Monitoring
A common annoyance with disk space monitoring are large volumes where an otherwise useful limit of, say 5%, is just not useful. For example, 5% of a 2 Tb drive is still 100 Gb, and in most cases there is probably no reason to sound an alarm. Dynamic thresholds (a new feature) addresses this issue by automatically adjusting the limit based on the drive size. The result: Fewer alerts!
EventSentry will log an event to the application event log when dynamic thresholds are enabled AND the current settings warrant a change. An event will look something like this:
The percentage-based threshold on drive F:\ has been dynamically adjusted from 5 percent to 0.5 percent based on the total drive size of 999 GB. A low disk space alert will be triggered when the available space on this volume falls below 19 GB.
Other Improvements
The software inventory page (detailed tab) will now show which hosts do NOT have a particular software installed when the search is restricted to a specific software product. Also related to processes, process tracking can now generate the checksum of all execute files, which can then be searched for at Malware databases like virustotal.com. If you utilize the maintenance mode feature in EventSentry then you can now see whether a host is in maintenance mode or not in the web reports. And last but not least, event logs can now be sent to a remote Syslog receiver via TLS.
Under the Hood
We always tweak and improve EventSentry to ensure it runs as efficiently as possible. In this release we replaced the SHA 256 algorithm with a more efficient version, resulting in less CPU usage by the agent when calculating SHA 256 checksums. As we gradually move to a full 64-bit monitoring suite, the Heartbeat Agent is the next component now also available as a 64-bit process so that all EventSentry services are now available in 64-bit. We plan on porting all executables over to 64-bit within the next 6-12 months. At that point you will not be able to run EventSentry on 32-bit platforms anymore; monitoring 32-bit hosts will of course still be supported for the foreseeable future.
To help with the stability of all EventSentry and simply troubleshooting, all server-side components will now automatically generate crash dumps if they encounters a problem. Finally, the management console includes additional context and ribbon buttons.