Capturing network traffic is usually done either for security reasons or to troubleshoot networking issues. But by the time you initiate a network capture (either manually or automatically) it’s often too late already – the train has already left the station.
Point in case: Say your SIEM (obviously EventSentry) detects abnormal or suspicious behavior in a log and a network capture is initiated. By the time the capture is started, the most relevant network traffic will likely have already occurred. The same applies to network problems – they are often spurious and starting a capture when you notice the issue will often be too late.
So what can you do? Capturing – and storing – network traffic on a regular basis is often not feasible due to the large amounts of data generated. Permanently writing all network traffic to disks (even if you were to rotate the collected pcap files) creates an enormous amount of disk I/O – something to avoid especially on SSD drives.
But what if you could – at any time – simply dump the last 100 Mb (or more …) worth of network packets with a single command to a .pcap file? Instead of installing or starting an app like Wireshark manually and initiating a capture, you simply issue a single command and done. What’s even better is that it dumps the last 100 Mb of data traffic – you’re capturing the past!
Well, now you can do exactly that with the EventSentry Network Capture service, a new component that is part of the free EventSentry SysAdmin Tools. This service continuously captures all network traffic in a memory-based ring buffer in the background (the size of the buffer is configurable) and dumps the captured network packets to a directory when needed. Better yet, the service is extremely light on resources and uses <1% of CPU time, no permanent disk I/O and most of its memory usage is for the network packet buffer.
The service is easily customized via command line parameters and logs all relevant information to the application event log.
The service does require that a Winpcap-compatible network driver (e.g. npcap) is installed. Out of the box it uses a 50 Mb memory buffer, capturing traffic on the first active NIC with a valid IP address. The default location for .pcap files is the %TEMP% directory.
NOTE: If you already have an earlier version of the EventSentry SysAdmin Tools installed, then you’ll need to uninstall & reinstall to see the new component in the installer.
Install the EventSentry SysAdmin Tools and make sure the optional EventSentry Network Capture service is checked
Review & customize settings
Once everything is setup, simply run a single command to capture the most recent network traffic.
If the dump was successful, event id 120 will be immediately logged to the Application event log:
This is also useful on systems where you frequently need to capture network traffic. Instead of loading up an app like Wireshark and waiting, simply dump the buffer and you’re done!
Monitoring temperature and humidity in a server room are quite important if you want to reduce the risk of expensive equipment failure. Yet, many server rooms either aren’t monitored at all or rely on ancient wall-thermostats that, in case of a problem, only emit desperate beeps that nobody will hear.
There are a lot of environmental sensors available to purchase, but many of these have a number of limitations:
Expensive
Only measure temperature
Don’t support SNMP
Require specific software
No display
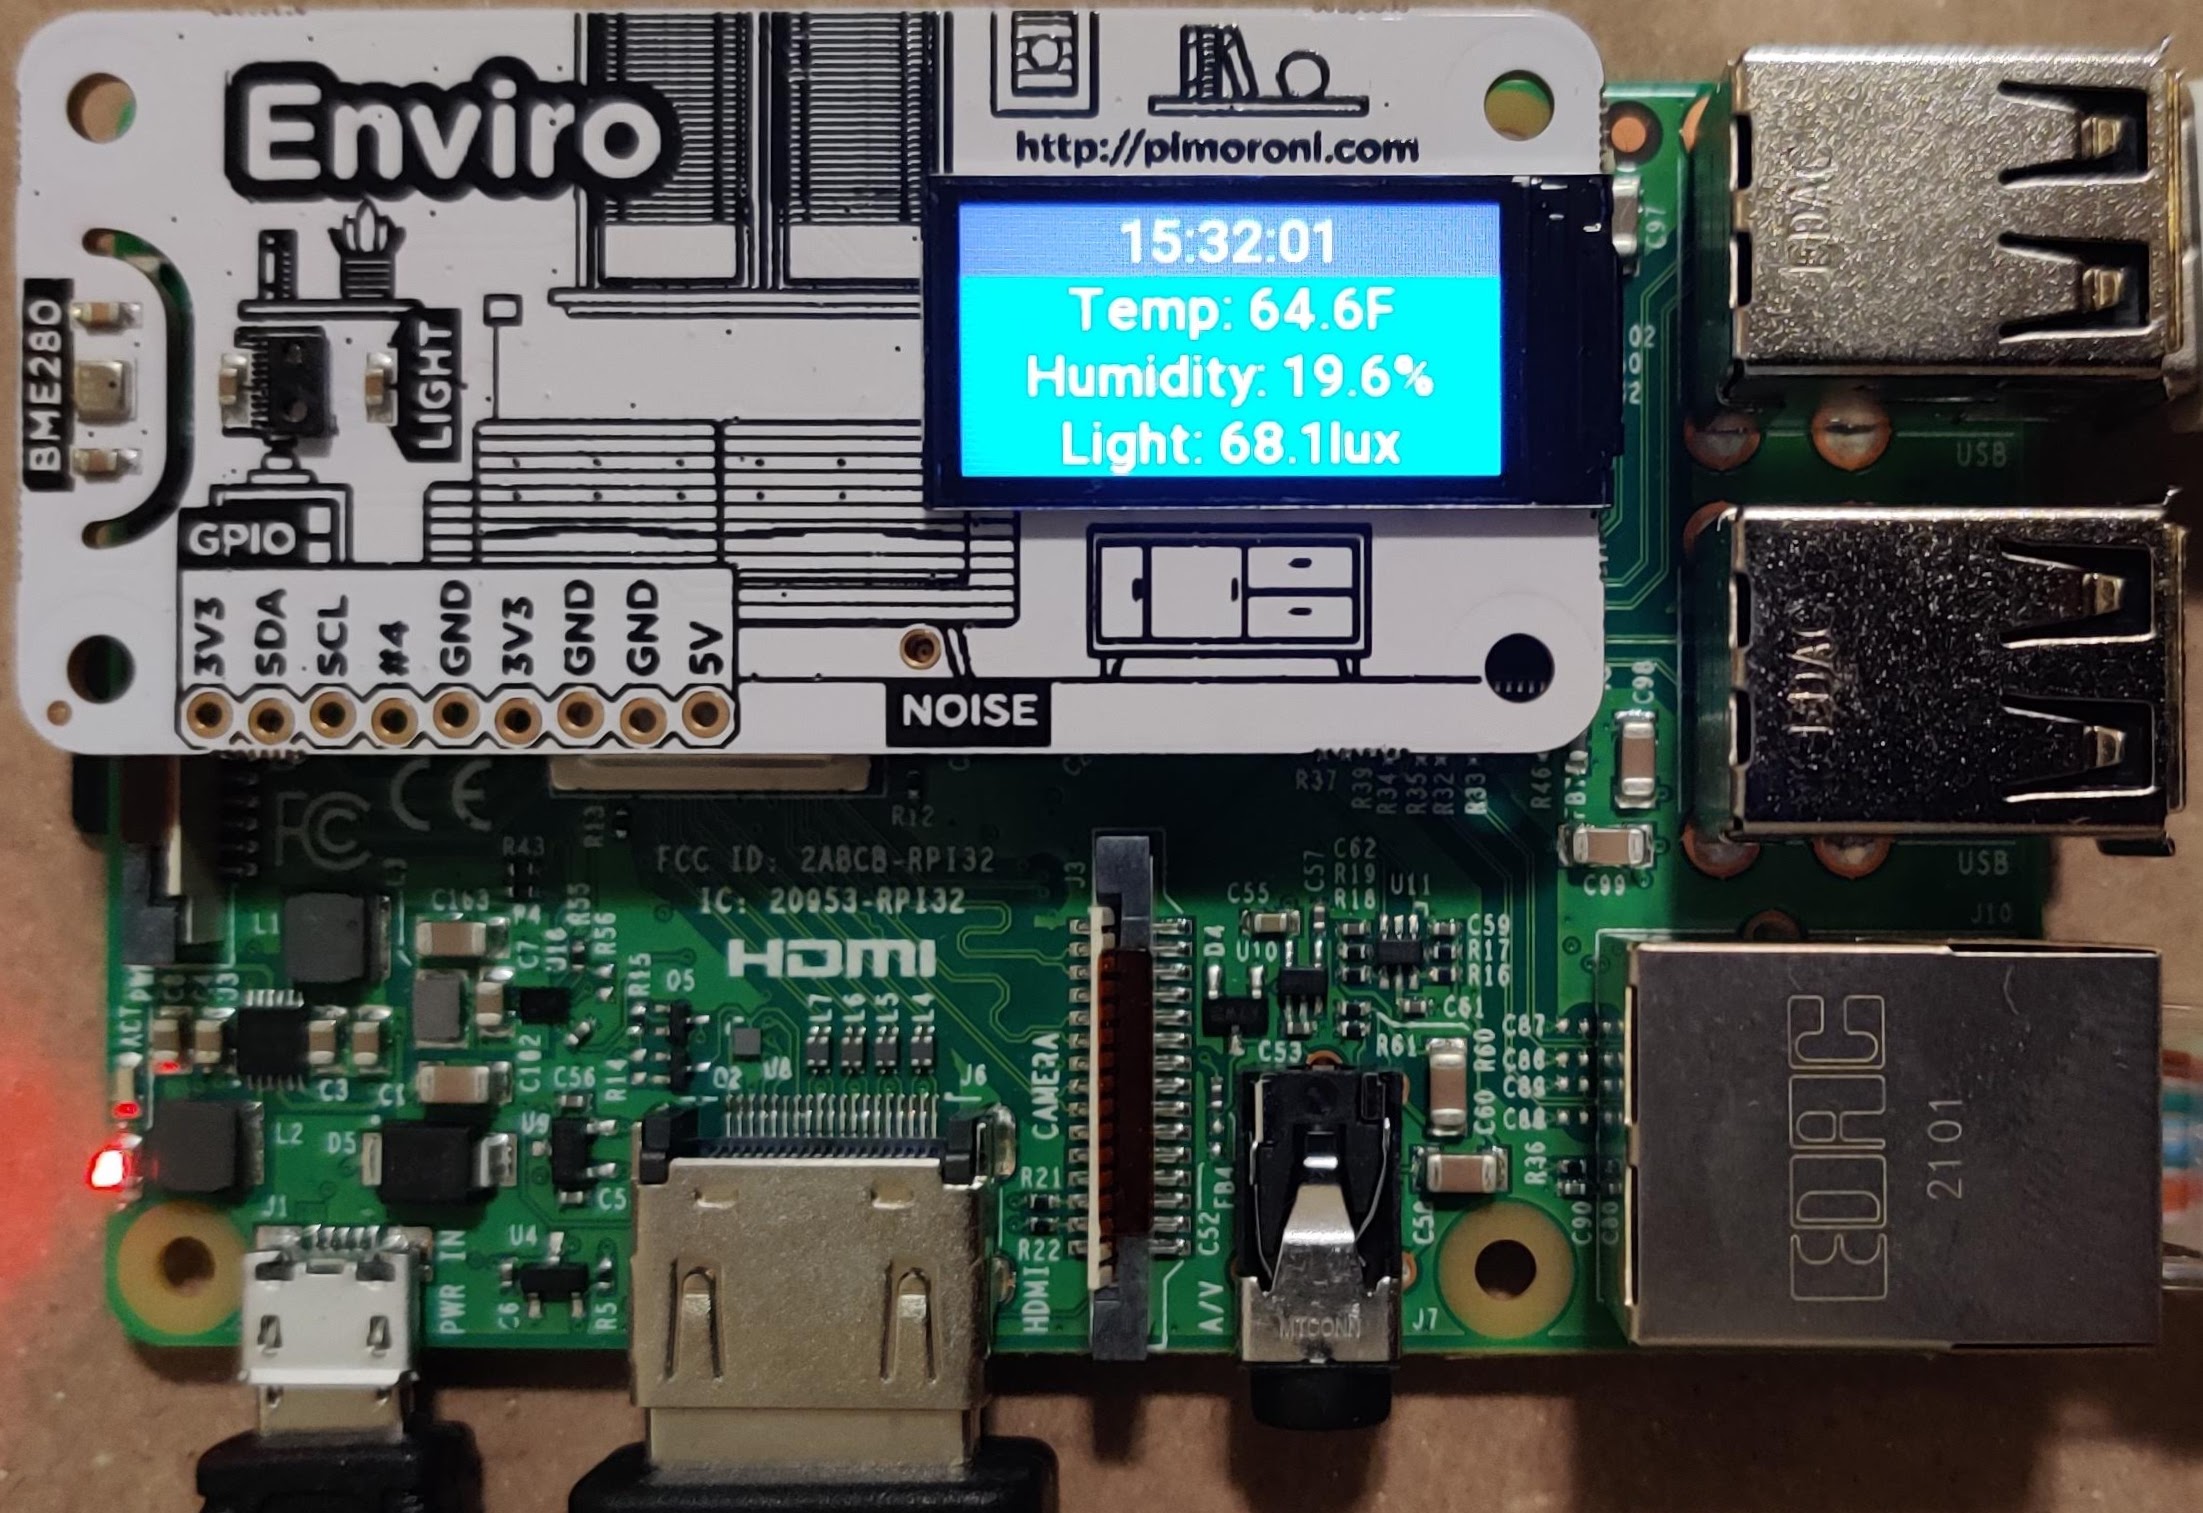
Wouldn’t it be nice if you could just create your own, networked environmental sensor that measures both temperature and humidity for around USD 100? In this post we’ll show you how to assemble this apparatus – based on a Raspberry Pi (most models work) – that does all this:
Measures temperature
Measures humidity
Measures light (bonus!)
Networked
Accessible via SNMP
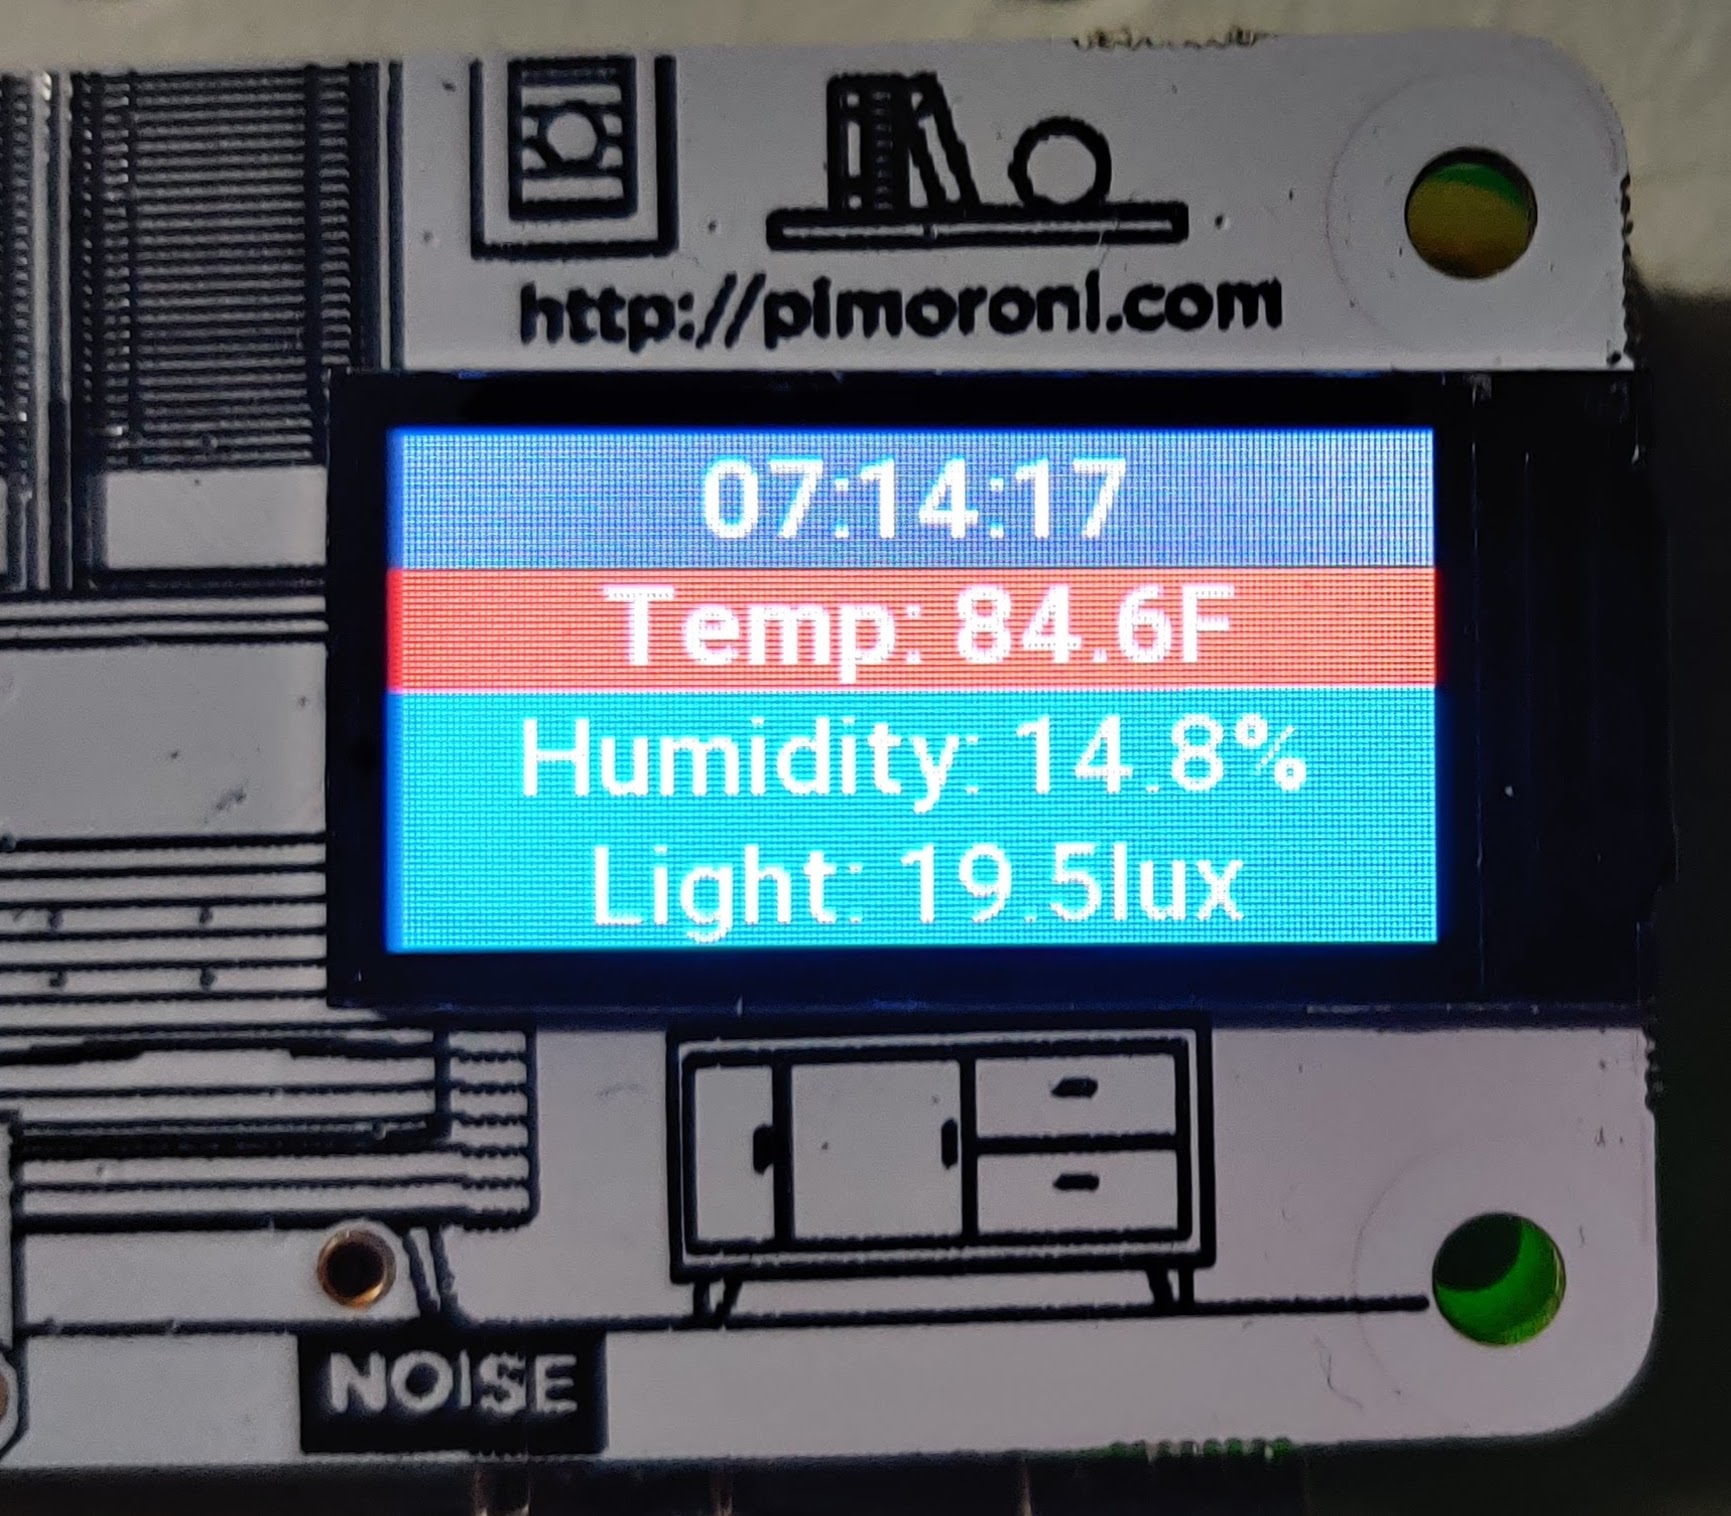
Shows current values on a display
You neither need to be an electronics whiz and nor will you need a soldering iron and block off an afternoon to “build” this sensor. The only assembling required is to connect the environment sensor “enviro” to the Raspberry Pi on its 40-pin connector. But let’s start with the require hardware (more details and purchase links are in section 6 below)
Raspberry Pi 3 or 4 (ideally with an ethernet port, Pi Zero with external USB ethernet adapters works too)
Once you have all the hardware together, simply connect the enviro sensor to the Raspberry Pi by gently pushing it onto the Raspberry Pi and connect the power adapter. The emphasis is on gently since the connector can sometimes be a tight fit and being impatient can damage the connector on the Raspberry Pi or the sensor. Once you’ve joined the two things together it’s time to address the software side of things and prepare the microSD card, for which you have 2 options:
1a. Use our pre-built image and simply change the IP address and password (fastest and easiest) 1b. Install a standard Raspbian OS and configure the sensor, scripts and SNMP daemon manually
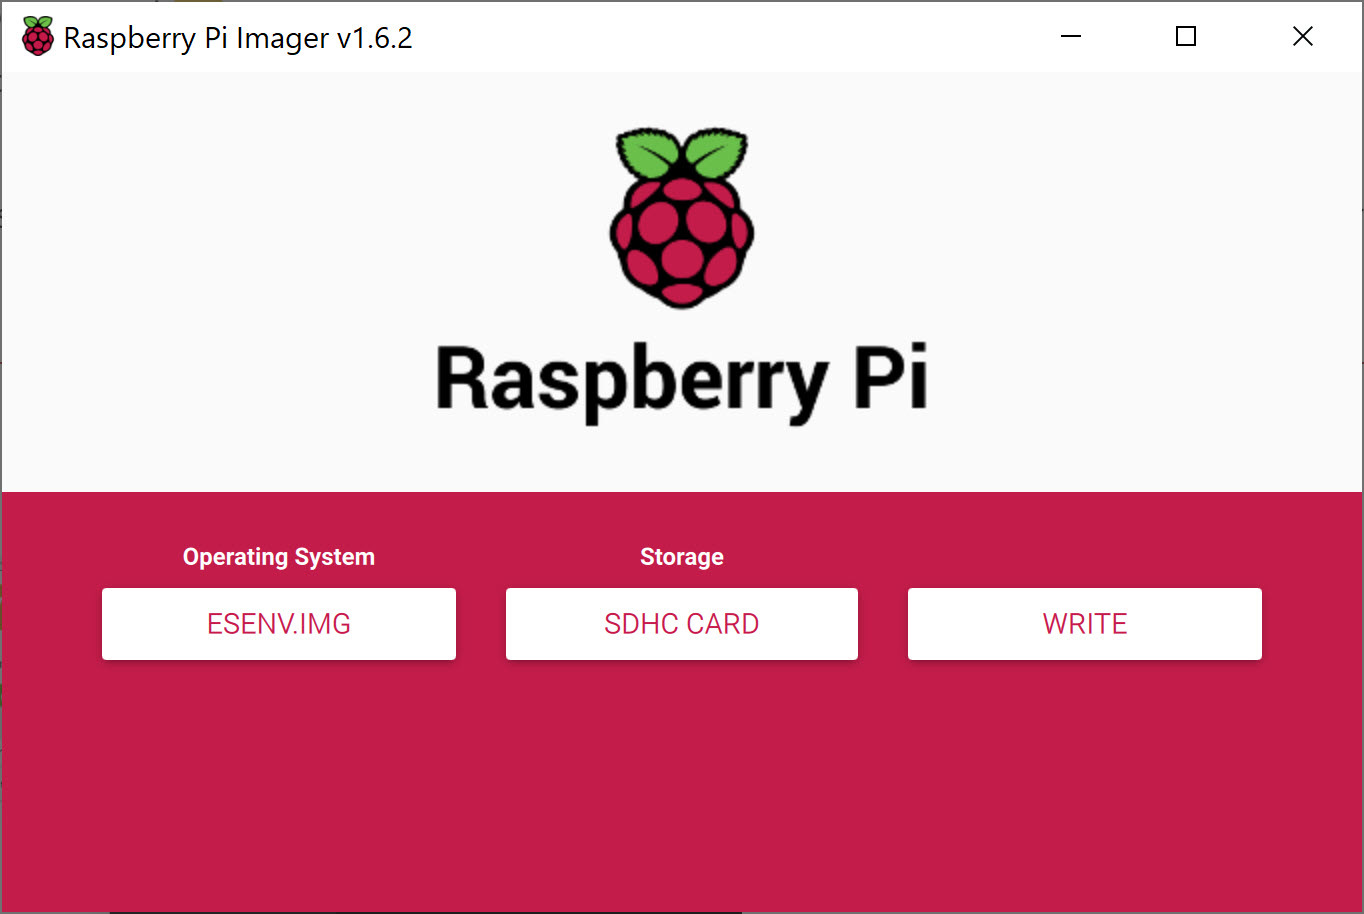
1a. Using the Pre-Built Image
First, download the image file and decompress it. While that’s downloading, download the Raspberry Pi Imager for your OS and insert the microSD card into your computer or adapter. Launch the imager once the image has been downloaded. In the imager, click CHOOSE OS and select Use custom. Then click on CHOOSE STORAGE and select the microSD card you’ll be using and click WRITE.
When complete, insert the microSD card into the Raspberry Pi, connect it to your LAN and power it up. The pre-built image is ready to go, and the only configuration necessary is setting a static IP address. You can do this either via SSH if you can determine its IP address (either through DHCP logs or ARP activity – if you have EventSentry installed then it can help with both) or with keyboard and monitor via HDMI. The default username and password for our image are:
Username: pi
Password: BlackRaspbe11y&
Hostname: eventsentry-enviro
Once you’re connected and logged in, it’s recommended to update all software packages of the Raspberry Pi to the latest version with the following commands:
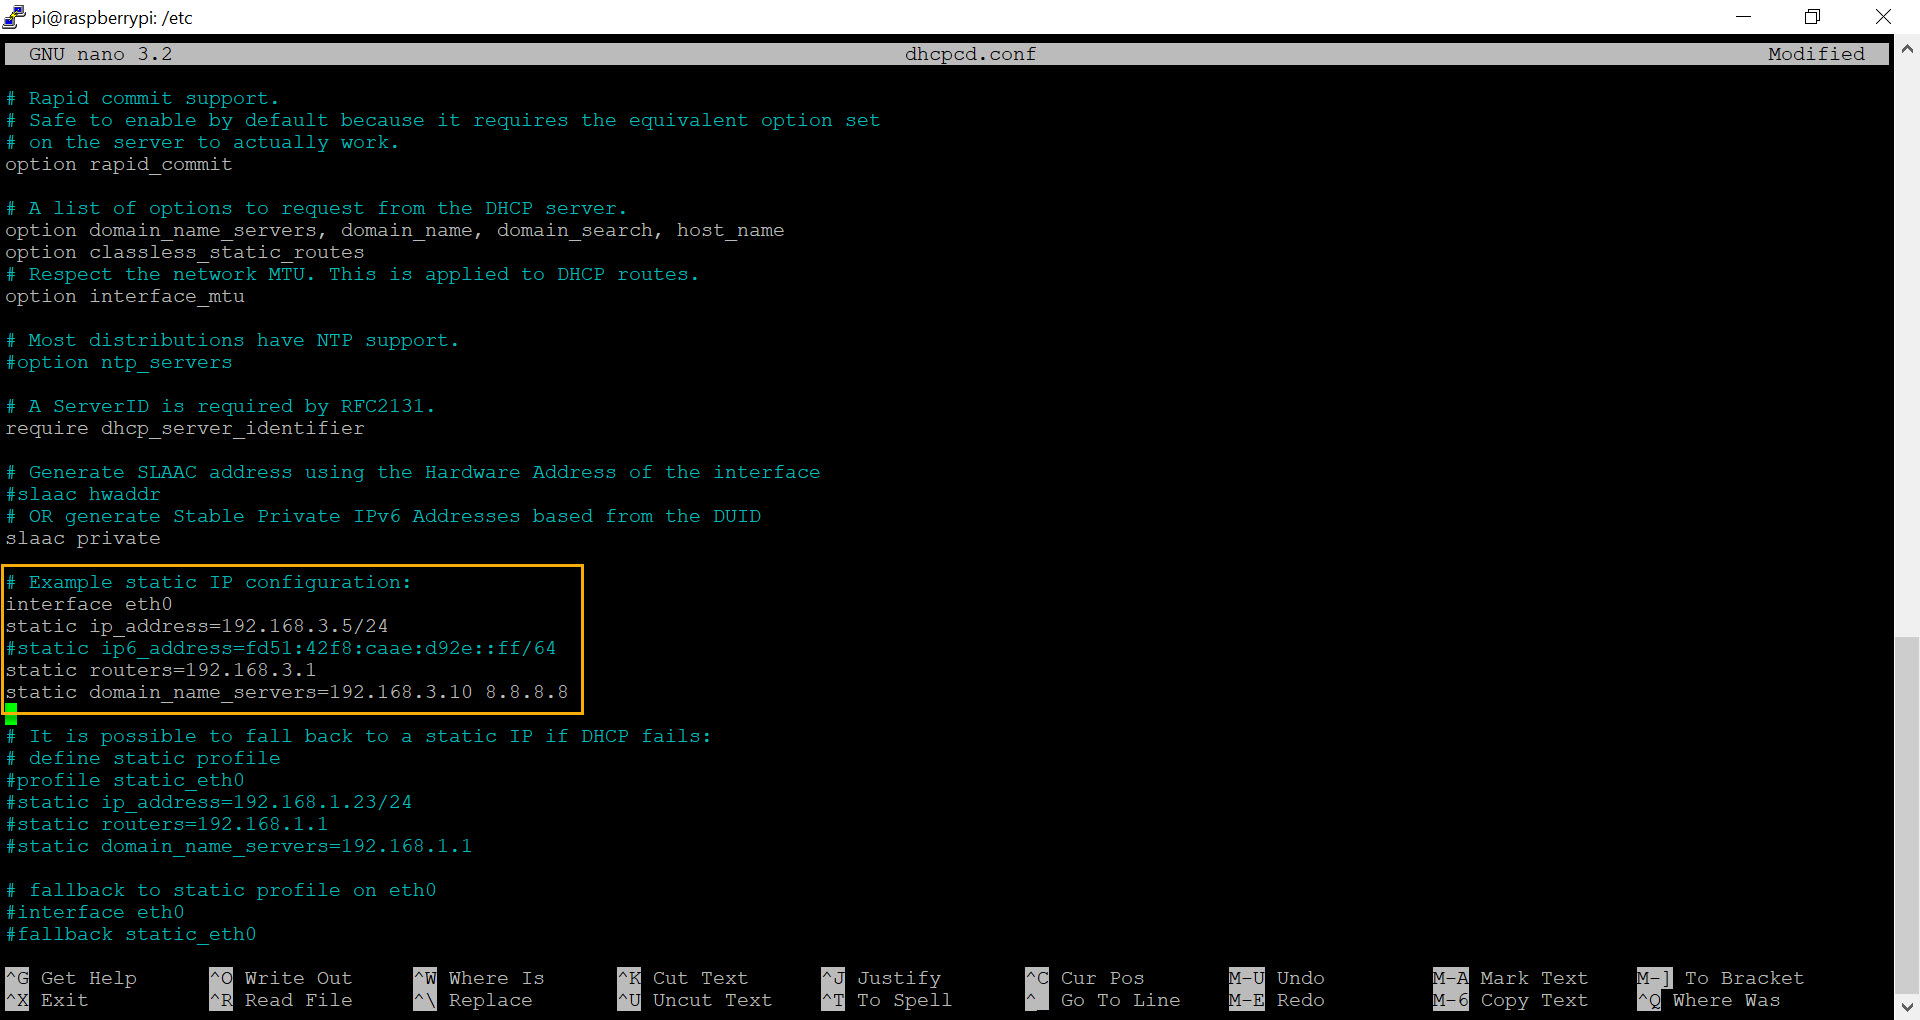
While not always necessary, reboot the Raspberry Pi after the last step and log in again. Then, issue the following command to open the network configuration file and set a static IP address:
sudo nano /etc/dhcpcd.conf
The nano text editor works like any Windows-based editor where you can navigate with the arrow keys. The configuration file already contains sample entries for a static IP address as shown in the screenshot below.
As such, simply scroll down to this section and replace the same IP addresses with the actual IP addresses of your router, DNS server and of course the desired IP address for your networked sensor. Don’t forget to uncomment the new configuration by removing the heading # characters. An example configuration is also shown below:
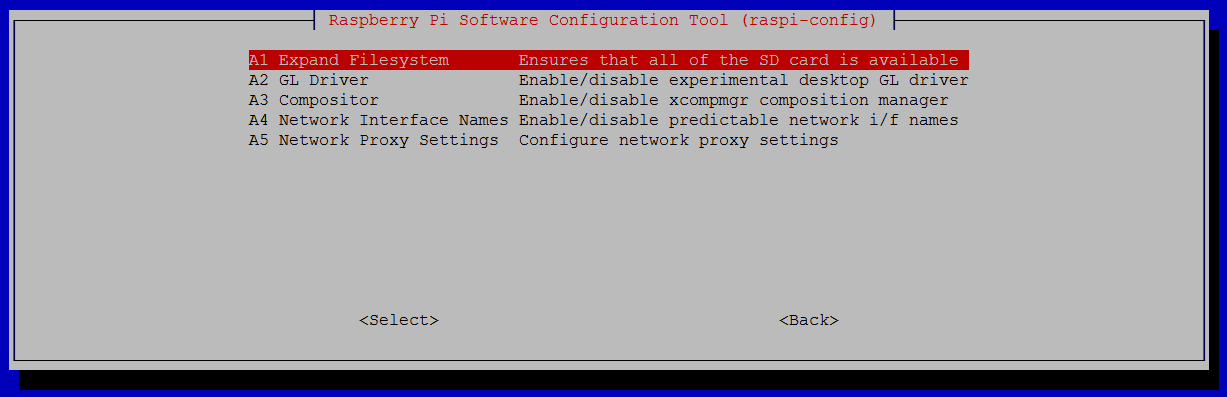
Once the configuration looks ok, hit CTRL+O followed by CTRL+X. The final step is to resize the root partition so that it utilizes the entire space available on the SD card (assuming the SD card is larger than 4Gb). This step is optional but recommended since it’s both easy and fast. From the terminal, run
sudo raspi-config
and select the following:
6 Advanced OptionsA1 Expand Filesystem
Note that there is no confirmation after selecting “Expand Filesystem”, instead you will be prompted to reboot the raspberry pi since the file system will be resized during the next boot. If you chose not to reconfigure the file system then reboot the device by running sudo reboot.
1b. Manual Setup with Raspbian
Insert the microSD card into your computer or adapter, download the Raspberry Pi Imager for your preferred OS and launch it. In the imager, click CHOOSE OS and select the first option, Raspberry Pi OS (32-bit). Then click on CHOOSE STORAGE and select the microSD card you’ll be using and click WRITE.
When complete, insert the microSD card into the Raspberry Pi, connect it to your LAN, connect a monitor & keyboard and power it up. After it booted, follow the setup process which will let you pick a language and ensure that your Pi is up to date.
In the OS settings, enable SSH access if you want to manage the pi remotely later.
Installing the enviro library
Open the terminal window and execute the following commands. I recommend installing the examples too when prompted. This basically enables support for the sensor in the OS and installs example Python scripts. If you do not change directories, then the files will be installed in /home/pi/enviroplus-python.
The EventSentry git repository contains two scripts and a MIB file to integrate the enviro sensor with the local SNMP daemon. The Python script (eventsentry_enviro.py) runs in the background, constantly polling the sensor, and writes the current readings to temp files. The Perl script (eventsentry_enviro_snmp_pass.pl) is called by the SNMP daemon whenever a specific OID is called and provides the temperature, humidity and light readings via SNMP.
Execute the following command, which will place all files in /home/pi/sensors/raspberry_enviro:
git clone https://github.com/eventsentry/sensors
Activate background polling script
The eventsentry_enviro.py script needs to be launched at startup and run in the background (via cron) in order to continuously poll the sensor and save current values to temp files. Run crontab -e and add the following line to the configuration:
With snmpd installed and the scripts downloaded, they can be integrated by editing the /etc/snmp/snmpd.conf file with
sudo nano /etc/snmp/snmpd.conf
The following lines need to be added to the snmpd.conf file. I would recommend adding them to the sections were similar entries already exist to make it easier to manage in the future:
view   systemonly  included   .1.3.6.1.4.1.21600
pass .1.3.6.1.4.1.21600.1.5.1.1.1 /usr/bin/perl /home/pi/sensors/raspberry_enviro/eventsentry_enviro_snmp_pass.pl
Just like before, save your changes in nano with CTRL+O followed by CTRL+X. If you prefer to change the default SNMP community (from the default “public”) then that can be done in the snmpd.conf file as well. When done, restart snmpd with the command below. This is technically optional since we’ll be restarting the Pi anyways, but not a bad idea to make sure there are no configuration errors in the snmpd.conf file.
sudo service snmpd restart
Finalize
To launch the all important eventsentry_enviro.py script and make sure your Raspberry Pi is self-sufficient even after a power failure reboot the pi again with
sudo reboot
2. Polling & Testing via SNMP
At this point you should be able to query the current temperature, humidity and light level with any SNMP manager, such as EventSentry. The EventSentry MIB has been updated to support the enviro sensor, and all values are returned as part of a table, making it easy to add additional readings without having to change the configuration on the SNMP manager (at least with EventSentry). The key connection details are as follows:
SNMP Version: 1, 2c
SNMP Community: public
One way to obtain the current values is with snmpwalk that is available with pretty much every Unix/Linux distribution and also installed on your Raspberry Pi.From the command line issue the following snmpwalk command (adjust the community if you changed it):
snmpwalk -v 2c -c public 127.0.0.1 1.3.6.1.4.1.21600.1.5.1.1.1
which should yield output similar to what’s shown below:
Where the temperature is 63 degrees F, the humidity is 18% and the current light level is 1 Lux.
3. Integrating with EventSentry
Integrating the sensor is straightforward and done in the management console. You can either add a single object in EventSentry that receives the values for all instances (temperature, humidity & light), or setup individual counters for each reading. The latter option requires additional configuration but allows you to setup individual alerts, something that is not possible with the first option.
3a. Adding all SNMP counters in a single object (table support)
If you want to skip steps 1-5 below then you can download a pre-made package from the management console. Simply click on “Packages”, click “Download” in the ribbon, proceed with the download and then select the “RaspberryPi Enviro” package from the “System Health Packages” section and import it. If, on the other hand, you want to practice your performance monitoring skills in EventSentry then follow steps 1-5 below:
Open the management console
Add the raspberry pi to an existing group under “Computer Groups”, or create a new group and add it there.
Select the host you just added and click the “Authentication” button in the ribbon to specify the SNMP credentials.
Under “Packages” – “System Health”, create a new package or find an existing one. Add the “Performance” object to that package if it doesn’t already exist.
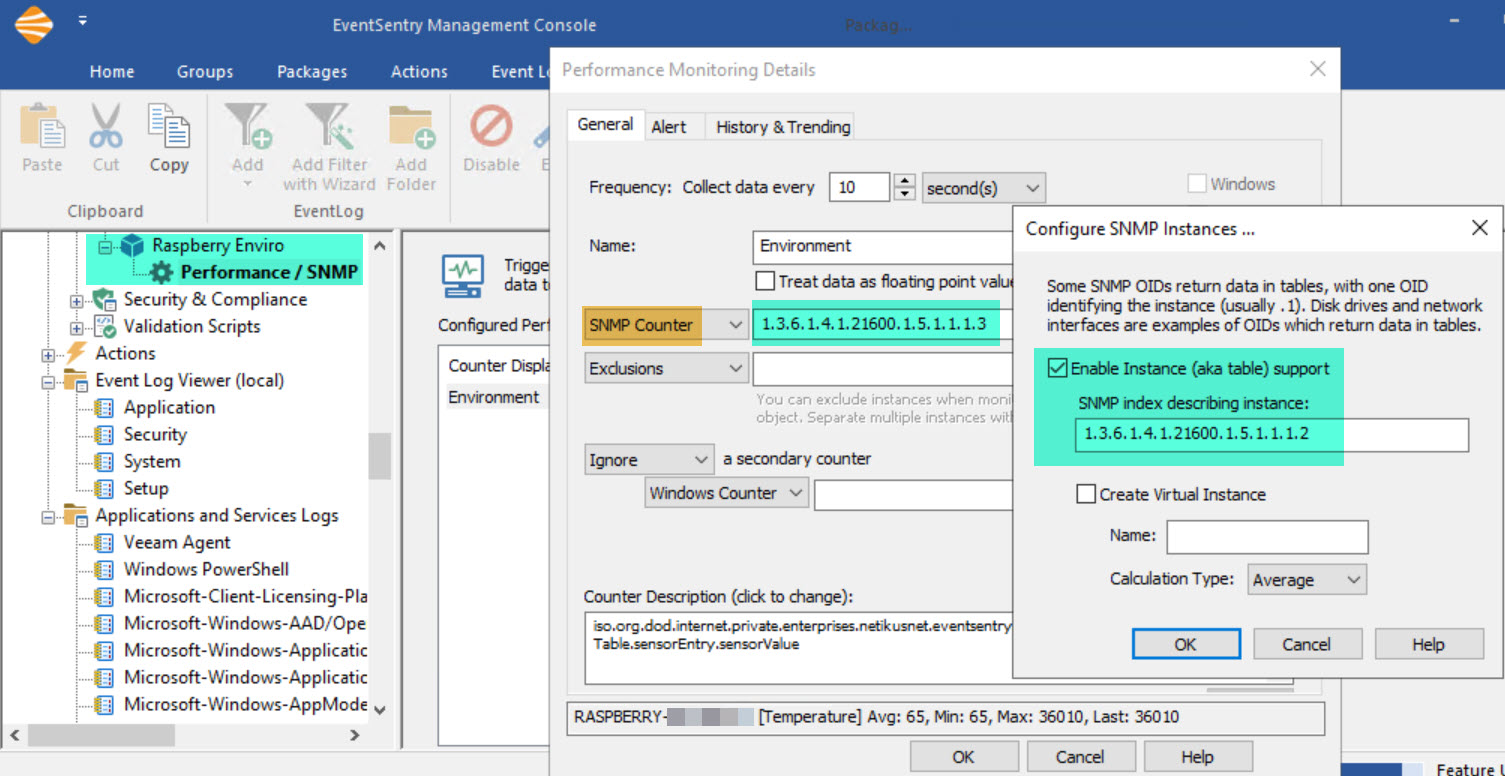
Click the “Performance” object and add a performance counter as shown in the screenshot below.
Alerts are configured on the “Alerts” tab but would affect all counters. This could be tricky, since you would not be able to set an alert for humidity > 60 and an alert for temperature > 80. Still, in this scenario you could actually setup an alert for a value > 80 that would likely be useful for both temperature and humidity, since you would probably not want either of those to be over 80. At a minimum, click the History & Trending tab to store collected values in a database. To verify that the raspberry pi is reachable via SNMP, click the Test button and enter the host name you added to the group earlier.
Showing temperature readings from 2 Piemoroni enviro sensors side-by-side in EventSentry
See the next section on how to setup individual counters for temperature, humidity and light.
3b. Setting up individual counters for temperature, humidity and light
The configuration for individual objects is very similar to the previous approach. Table support will not be used however, and each counter will have its index value appended to the original OID used in 3a.
Add the raspberry pi to an existing group under “Computer Groups”, or create a new group and add it there.
Select the host you just added and click the “Authentication” button in the ribbon to specify the SNMP credentials.
Under “Packages” – “System Health”, create a new package or find an existing one. Add the “Performance” object to that package if it doesn’t already exist.
Click the “Performance” object and add three performance counters as shown in the screenshot below.
Temperature Counter
Then, simply duplicate the above setting for humdity and, if required, for the light sensor as well. You just have to change the Name and the SNMP counter as shown above. Since every measurement now has its own counter, it is possible to setup individual alerts.
To verify that the raspberry pi is reachable via SNMP, click the Test button and enter the host name you added to the group earlier.
4. Accuracy
The enviro sensor uses the BME 280 by Bosch to measure temperature, humidity and pressure. You can review the datasheet of the BME 280 sensor for more information on accuracy, operating ranges and such. The overall accuracy for the temperature sensor is about +/- 3 degrees Fahrenheit, the humidity sensor has a similar accuracy of about +/- 3%.
Since the sensor board sits directly on top of the Raspberry Pi, Pimoroni explains that the temperature of the Raspberry Pi board (the CPU in particular) can affect the temperature readings, causing them to be higher than the actual surrounding temperature. I suspect that different Pi models (Pi v3, v4, PiZero, …) will affect the temperature differently. They do include a Python script that automatically corrects that, and our script does as well. Still, I would probably not use this sensor for scientific measurements that require a high accuracy. However, for normal usage where you are mainly trying to determine whether a specific location is dangerously hot (or humid), the sensor’s accuracy should be more than sufficient.
5. Visual Alerts
By default, the sensor will show the temperature or humidity in red under the following circumstances:
1. The temperature is higher than 80F 2. The humidity is lower than 10%
These thresholds are hard-coded in the eventsentry_enviro.py script and can easily be changed. Simply open the script in an editor and adjust these lines on the top of the script:
thresholdTemp = 80
thresholdHumidity = 10
Restart the Pi so that the new values become effective.
6. Hardware
Here are some links to the required hardware for this project in one place. Again, keep in mind that at the time of writing the Raspberry Pi 4 (and 3) are somewhat hard to get so you may need to try different sites or even pre-order.
When purchasing the standard Pi case it’s recommended to leave the top off, so that the sensor readings are more accurate. We are currently working on creating a custom case that will only cover part of the case in order to ensure the sensors are not blocked – stay tuned!
7. Troubleshooting
Sometimes thing just don’t work like the should no matter how hard you try. Here are the most common things to check if you are unable to retrieve the environment measurements via SNMP:
Enviro Sensor
Since everything ultimately depends on the actual hardware sensor working, the first troubleshooting step would be to make sure that the sensor is working. You can of course skip this step if the sensor LCD display is showing environment readings.
If you are getting error messages then see ” Installing the enviro library” earlier and rever to the enviro web page for more information.
Automatic Sensor Polling
It’s important that the EventSentry enviro polling script is launched automatically at boot, see section “Activate background polling script” earlier. You can run the following command to verify that the script is indeed running. You should see lines.
If you’re getting environment measurements and the SNMP daemon is running then it’s time to dig deeper and see if the SNMP is responding to GET requests. Run the following snmpwalk command, the output should look similar to what’s shown below. Again, replace “public” with your actual SNMP community if you changed it.
pi@eventsentry-enviro:~ $ snmpwalk -v 2c -c public 127.0.0.1 1.3.6.1.4.1.21600.1.5.1.1.1
iso.3.6.1.4.1.21600.1.5.1.1.1.1.1 = INTEGER: 1
iso.3.6.1.4.1.21600.1.5.1.1.1.1.2 = INTEGER: 2
iso.3.6.1.4.1.21600.1.5.1.1.1.1.3 = INTEGER: 3
iso.3.6.1.4.1.21600.1.5.1.1.1.2.1 = STRING: "Temperature"
iso.3.6.1.4.1.21600.1.5.1.1.1.2.2 = STRING: "Humidity"
iso.3.6.1.4.1.21600.1.5.1.1.1.2.3 = STRING: "Light"
iso.3.6.1.4.1.21600.1.5.1.1.1.3.1 = INTEGER: 64
iso.3.6.1.4.1.21600.1.5.1.1.1.3.2 = INTEGER: 18
iso.3.6.1.4.1.21600.1.5.1.1.1.3.3 = INTEGER: 0
iso.3.6.1.4.1.21600.1.5.1.1.1.3.3 = No more variables left in this MIB View (It is past the end of the MIB tree)
SNMP works remotely
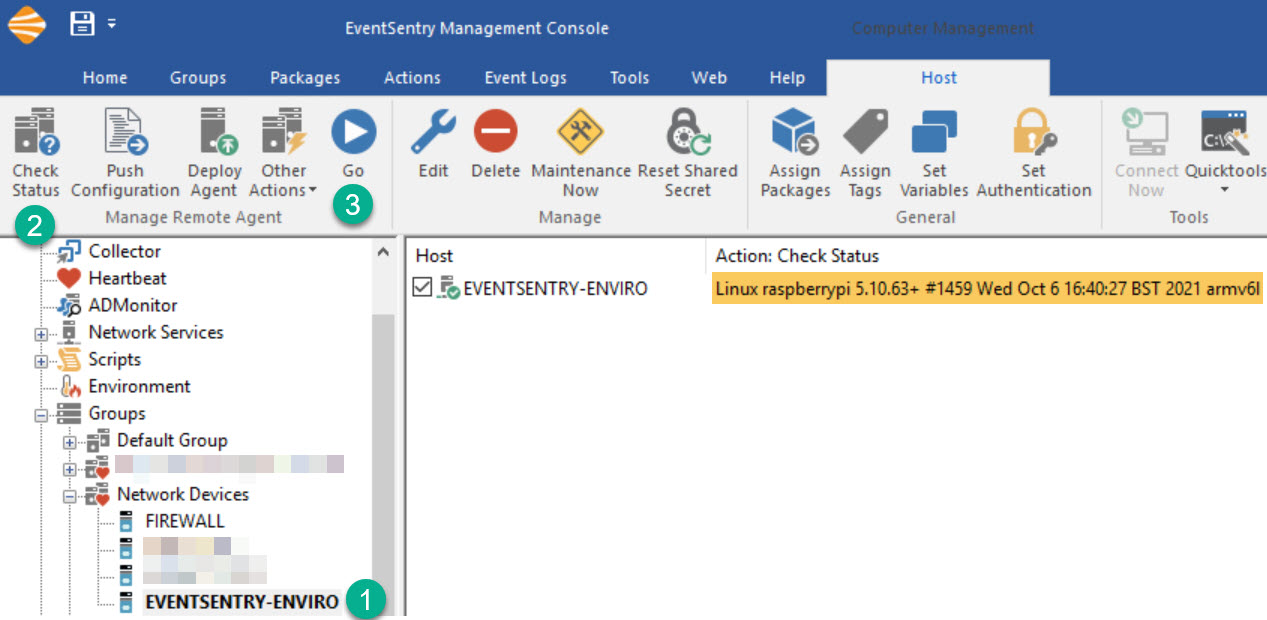
Since the Raspberry Pi does not have a firewall activated by default it’s unlikely that SNMP will work locally but not remotely. In any case, you can either run snmpwalk from a remote machine that has it installed, or use EventSentry to verify that the Raspberry Pi is accessible via SNMP.
Open the management console, selec the host entry for the Raspberry Pi, click “Check Status” followed by “Go” and review the results.
Just when the Microsoft Exchange exploit CVE-2021-26855 thought it would win the “Exploit of the year” award, it got unseated by the – still evolving – Log4J exploit just weeks before the end of the year!
Had somebody asked Sysadmins in November what Log4J was then I suspect that the majority would have had no idea. It seems that the biggest challenge the Log4J exploit poses for Sysadmins is simply the fact that nobody knows all the places where Log4J is being used. Most exploits affect a specific piece of software or hardware equipment, but Log4J is not a separate product, it’s just sitting somewhere on the file system of some Java application – likely among a myriad of other open source libraries.
So how do you find vulnerable instances of Log4J on a network without spending hours running scripts and manually going through software inventory? And, how do you ensure that it stays that way, and a vulnerable version of Log4J doesn’t get installed at a later point?
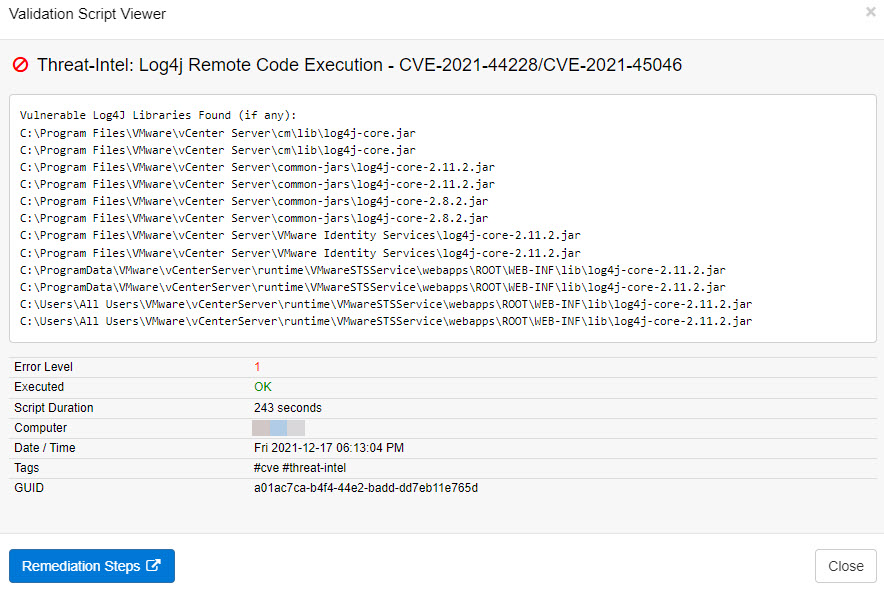
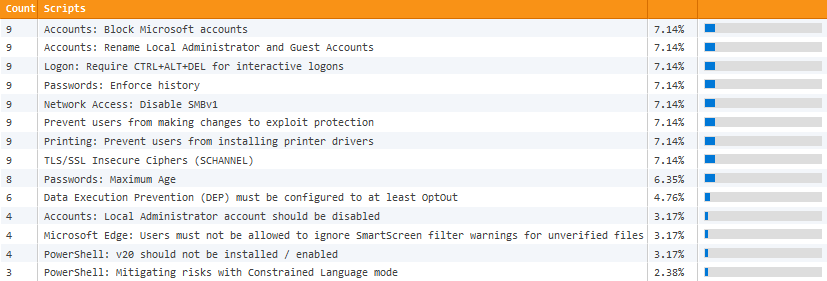
The answer to that question are EventSentry’s validation scripts. If you’re running EventSentry 4.2 or later, then you can utilize its validation scripts engine to discover vulnerable instances of Log4J on your monitored Windows-based systems with the latest Log4j discovery script.
As a reminder, validation scripts validate best practices across your infrastructure, and are regularly updated by EventSentry to detect insecure settings, outdated Windows systems and potential exposure to exploits.
The Log4j discovery script can be assigned to any Windows-based host, and will scan the hard drive to discover all vulnerable Log4j libraries on a system. In most cases the script takes fewer than 5 minutes to run, and the results can be viewed in the Web Reports under Health -> Validation Scripts -> Status as soon as the script has finished executing. Simply filter on the script name on the Summary page or specify this query to filter the validation script results
script:"*Log4j*" AND passed:No
Please note that the speed with which the script executes may vary by host since the speed depends on the number files scanned, disk speed etc.
This latest update to EventSentry improves your security posture with validation scripts, simplifies IT troubleshooting for both administrators and users, gives you visibility into installed browser extensions along with many other usability improvements in the web reports.
Validation Scripts
Proactively identifying (potentially) malicious behavior is the cornerstone of any security defense, and a key feature of log management / SIEM solutions. But many security violations are the direct consequence of incorrect or missing settings on endpoints.
Traditional log management solutions may show you when something is happening that shouldn’t be happening, yes. But wouldn’t it be better to assess key OS components and security settings on a regular basis, and identify known weaknesses?
Consider a motion-triggered camera that will let you know when somebody is snooping around your property at 3AM in the morning. That camera is extremely important, and the foundation of any serious property security system – without it, you wouldn’t even know what was going on!
But wouldn’t it be even better if somebody was inspecting your windows, fence and locks on a regular basis, to let you know if a door or window was unlocked, or an insecure lock was being used at one of the entrances? If your overall perimeter was more secure in the first place, there would be fewer potential intrusion attempts.
And that’s exactly what EventSentry’s 60+ validation scripts do. Our managed security & health checks continuously compare critical settings on your monitored hosts with our baseline, immediately indicating potential risks. These checks identify a wide variety of potential risks, such as:
A Windows server/workstation is not on the latest patch
Windows firewall is disabled
No A/V software installed
Insecure TLS protocols are enabled
Microsoft accounts aren’t blocked
EventSentry already includes a number of features that help detect security violations, rogue network devices, unauthorized software, suspicious network activity and more. But by utilizing the new validation scripts, you can fix many problems at the source – before they show symptoms.
The scripts are managed by NETIKUS.NET, updated regularly, and can be downloaded through the management console with a single click. Validation scripts are also tagged with keywords such as #server #compliance #stig-high-server to make sure that only relevant checks are assigned.
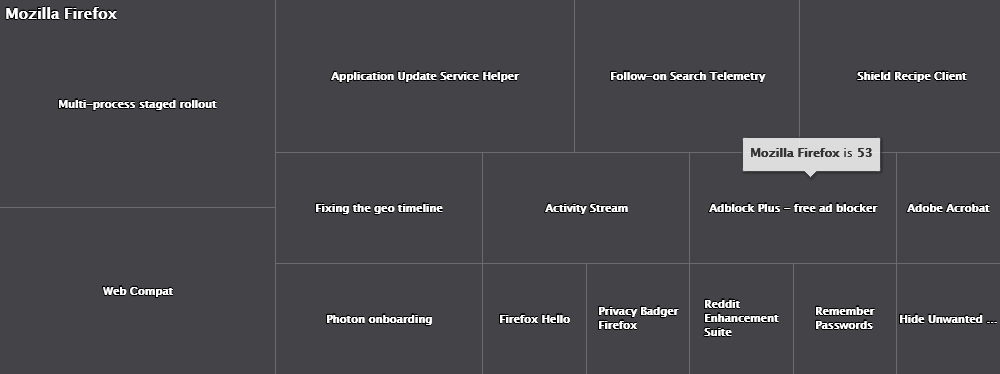
Which Browser Extensions are lurking in your network?
While web browser extensions can boost productivity and excite your end users, they also have inherent privacy and security risks. All major web browsers let users install as many extensions as they wish by default – without restrictions!
But do you actually know how many Firefox, Chrome or Edge extensions are installed on browsers across your IT infrastructure?
As an “extension” (no pun intended) of EventSentry’s software monitoring component, all browser extensions of Mozilla Firefox, Google Chrome and Microsoft Edge (Chromium-based) are inventoried with support for:
Alerts (extensions are installed/updated/uninstalled)
Searchable inventory
With this information at the fingertips, an initial discovery can be performed, a baseline set and reports or alerts can be received on a regular basis showing new extensions being installed.
Troubleshoot, Document & Support End Users with “EventSentray”
Supporting your end users has probably never been more challenging, considering they’re distributed all across the place and not conveniently squeezed into an office building anymore.
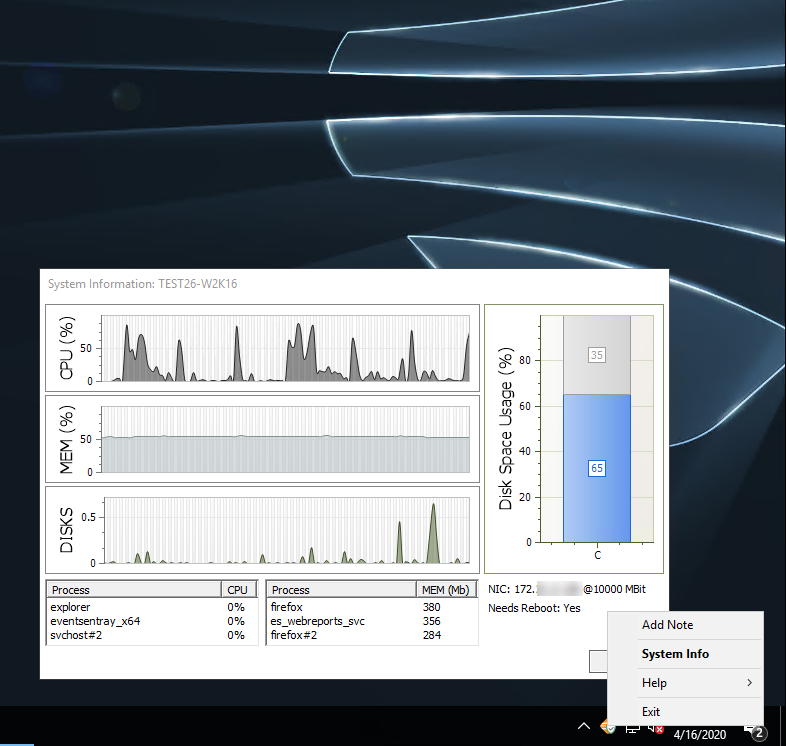
With the tray app “EventSentray”, your end users can submit support tickets to many common ticketing systems via email or HTTP requests right from the tray with a customizable link. And the best part? Support tickets created by the app not only include pertinent system information (current CPU %, host name, uptime, …) but can also include a current screenshot.
But we didn’t just design the tray app to give end users a way to submit support tickets right from their desktop, but also to help sysadmins.
Let’s be honest, when we log on to a server then it’s often because something isn’t working the way it should. Wouldn’t it be nice if one had easy access to information like:
CPU, Memory, Disk Usage & Utilization
Top 3 apps consuming CPU and memory
IP address, host name and connection speed
Whether the host needs a reboot
Simply double-clicking the EventSentry icon and the System Information dialog will show all of the above information – and more. Hovering over the charts will reveal additional hardware information as well.
And for those working in teams with shared responsibilities, right-clicking the tray app also lets you add notes (including a screenshot) for the monitored host. Those notes are then visible in the web reports and ensure that everyone on your team is on the same page when you make significant changes to a server or workstation. Documentation is key!
Tracking Administrator Activity
Many compliance frameworks require that you track activity by Administrators (e.g. Domain Admins) on your network. ADMonitor users now have the ability to filter all compliance reports (e.g. Logon Activity, Process Activity) to only show activity from users with domain admin privileges.
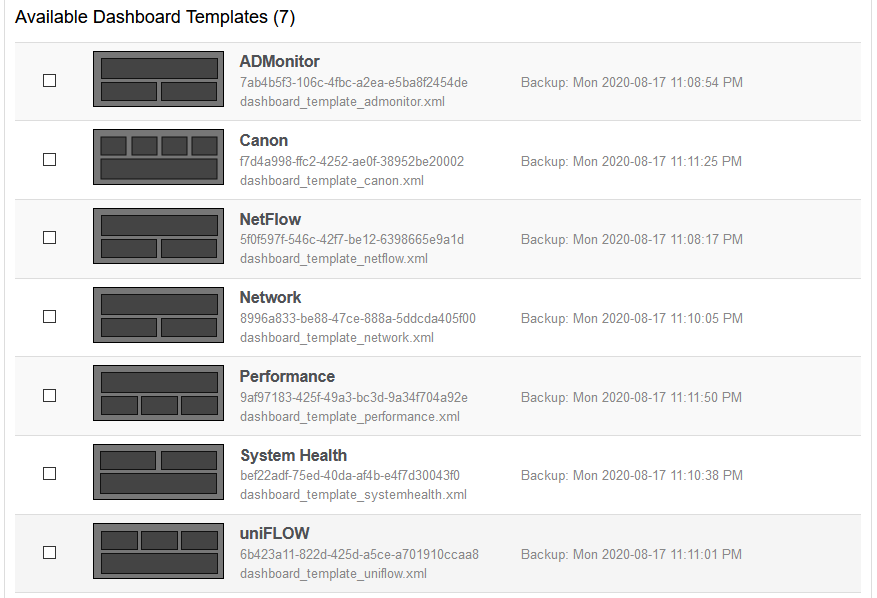
Dashboard Import / Export
To make setting up dashboards easier and faster, EventSentry now ships with a number of dashboard templates that you can import. You can also export your own dashboards and import them on another EventSentry installation.
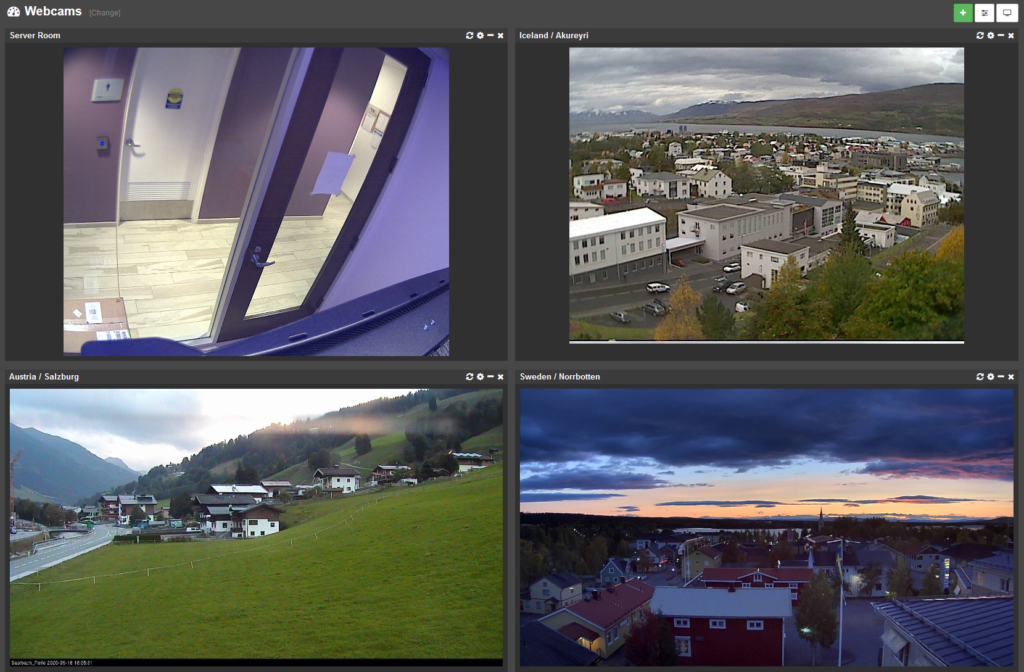
Webcam & Image Dashboard Tiles
The latest edition of the web reports includes a number of dashboard improvements, but the new image / webcam tile type definitely sticks out.
With the new “Image” tile you can point the web reports to a static image or stream to be displayed on any dashboard!
Since Active Directory is the foundation of all Windows networks, monitoring Active Directory needs to be part of any comprehensive security strategy. Up to version 3.5, EventSentry utilized Windows auditing and the security event log to provide reports on:
User Account Changes
Group Changes
Computer Account Changes
While this functionality provides a good basis for monitoring the most relevant changes to Active Directory, we felt that a more comprehensive approach to monitoring Active Directory was needed – without the need to install & maintain yet another product!
ADMonitor is new (optional) component included in EventSentry that vastly improves Active Directory monitoring with these additional features:
Monitors changes to all objects (e.g. OUs) – not just users/groups/computers
Captures every attribute change made to an object, not just high level changes
Provides before & after values for all changes
Monitors Group Policy changes
User status reports (show idle users, users with non-expiring passwords, …)
Monitoring does not require auditing
We’re excited that we can now offer EventSentry ADMonitor to our users who are looking for a more in-depth Active Directory monitoring solution.
Active Directory is essentially a representation of the employees and their roles in your organization. But employees come and go, roles/responsibilities change, contractors get temporary access and so forth. But while adding users and additional access is usually reflected properly in Active Directory (otherwise IT would get a call because somebody presumably can’t do their job), removing access is often forgotten. As a result, users that should have been removed from AD a long time ago continue to exist. With ADMonitor it’s easy to identify orphaned user accounts (and many others) and keep your Active Directory lean and clean.
Discover weak links in Active Directory
Since a significant development effort stands behind ADMonitor, it will be offered as an optional component that is licensed on a per-user basis. Pricing is very competitive with other solutions and we also offer bundle discounts to customers who already own or will purchase agent licenses; please request a quote here.
But enough theory, let’s look into the installation, configuration and reporting of ADMonitor.
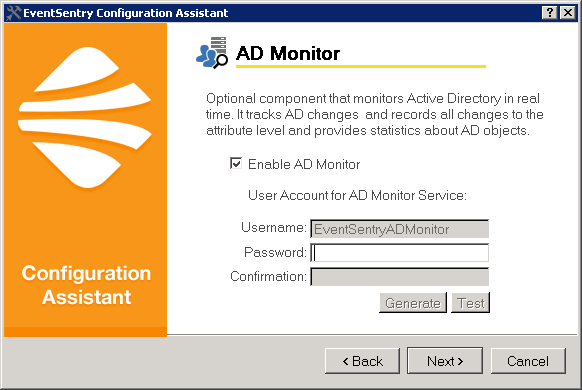
Installation
Since ADMonitor is a component of EventSentry, it’s easily activated as part of the main EventSentry setup. Just like with other components of EventSentry (Heartbeat Monitor, Collector, …), users have the option to enable ADMonitor during the post installation setup procedure.
ADMonitor can be installed on any host that is part of the domain that needs to be monitored, it does not need to be installed on a domain controller.
Enabling ADMonitor
Immediately following the initial installation, ADMonitor will initialize itself by creating an offline copy of all Active Directory objects. This process can take from a few seconds to a few minutes, depending on the number of objects in AD, connection speed to the domain controller as well as the overall performance of the host running ADMonitor.
Configuration
The initial configuration of ADMonitor is simple and only requires you to pick a password for the ADMonitor service account. If you’re adding ADMonitor to an existing installation you may also need to select the appropriate EventSentry database action to which ADMonitor reports changes. Otherwise, ADMonitor is ready from the get go and will monitor all Active Directory changes.
Reporting
ADMonitor provides three types of reports:
Object Changes
Group Policy Changes
User Status
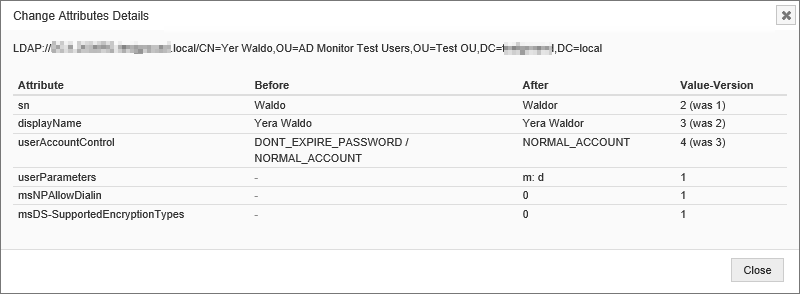
Object Changes
Shows any change made to an AD objects. Reports can be filtered on the type of action performed (added, removed, modified), on the object type (user, group, organizationalUnit, …) and on the user who performed the action.
ADMonitor Object Changes
Note that the detailed changes to group policies are available in the “Group Policy Changes” report below. Of course you can expect the same type of summary view you’re already used to from most other EventSentry features and create reports like:
Show all changes to organizational units
Show all new objects created
Show all users that were changed
and more
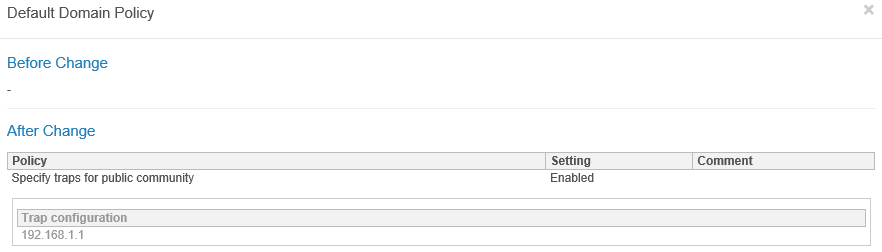
Group Policy Changes
When a group policy is changed, it is first indicated on the “Object Changes” report, since the versionNumber attribute of the AD object changes. The actual group policy settings themselves are available on the “Group Policy Changes” report however, since group policy settings are not stored in AD.
The screen shot below shows that the Default Domain Policy was changed, with the Specify traps for the public community setting being enabled.
ADMonitor Group Policy Change
Users
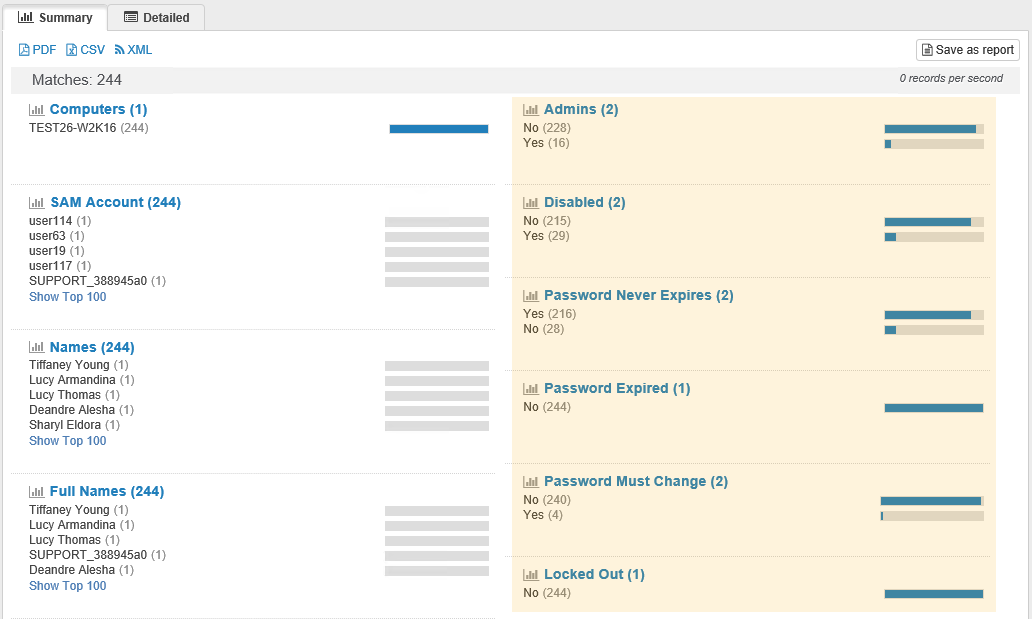
The users report helps you identify potentially problematic user accounts such as idle users, users who haven’t change their passwords in years and others.
This report contains a list of all user objects in Active Directory including the following details:
Name, Full Name, SAM Account Name, Path, UPN
Administrative Account (yes/no)
Disabled (yes/no)
Password Never Expires (yes/no)
Password Expired (yes/no)
Password must change (yes/no)
Locked Out (yes/no)
Last Logon
Password Last Set
Account Expiration Date
Creation Date
ADMonitor User Overview
With ADMonitor you can now get detailed user stats with just a few clicks and quickly identify user accounts that need to be reviewed, changed or deleted. Of course you can also schedule all reports directly from the web reports and get daily/weekly AD status reports directly in your inbox, e.g.:
List of all Group Policy changes
List of all idle user accounts
List of all newly created users and/or groups
You can also create your own reports for just about anything that involves a change to an Active Directory object, for example all organizational units created in the last 24 hours.
ADMonitor also includes a number of stand-alone utilities that support advanced features such as filtering and email notifications that I will cover in a future post.
With ADMonitor, EventSentry users can now gain the additional visibility needed to fully audit all Active Directory & Group Policy changes. As a result, EventSentry users can more easily enhance compliance, security and accountability in their network without the need to install additional software – saving both time and money.