The faulty Rapid Response Content CrowdStrike update that disabled millions of Windows machines across the globe on 7/19/2024 was any IT professional’s nightmare. Having to manually visit and restore each affected machine (further complicated by BitLocker) severely limited the recovery speed, especially for businesses with remote locations, TVs, kiosks, etc.

Of course, we’re all used to seeing bugs in the OS, our phones, and third-party software—but the impact is usually much less severe than what was observed on that fateful Black Friday. Prior to this incident, the majority of IT staff probably never imagined that an outage like this was even possible (and it appears as if CrowdStrike’s management team didn’t either).
It doesn’t come as a surprise, then, that many who were directly affected by this bug are seriously concerned about the software running on their networks—especially monitoring and security software like EventSentry that sits on most endpoints. How many more ticking time bombs are there that can take out everything within minutes? Many customers who use CrowdStrike also use EventSentry and are naturally wondering whether the EventSentry agents also have the “capability” to cause a BSOD.
The good news is that, since EventSentry is a user-mode service that does not directly run any code inside the Windows Kernel, it cannot cause a system crash like the CrowdStrike Falcon sensor did. A similar bug in the EventSentry agent would “merely” cause the EventSentry agent to terminate (“crash”) and normally restart automatically.
All EventSentry updates (including patches) are tested on our supported operating systems with a variety of configurations prior to release. This ensures that potential bugs affecting OS stability are identified before they are released to customers.
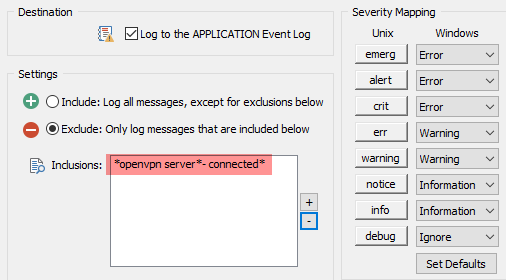
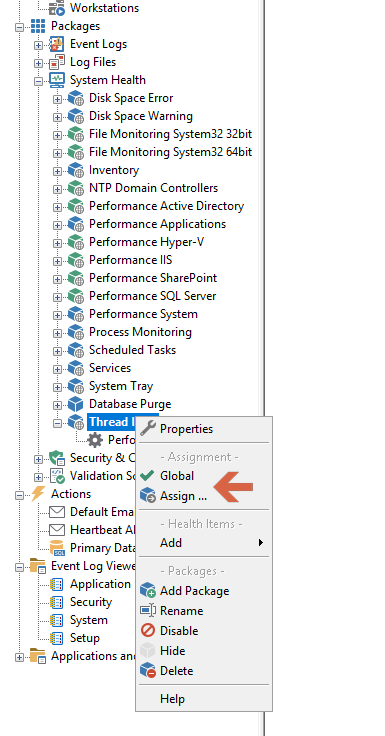
However, EventSentry is a highly configurable monitoring suite that provides users with myriad ways to customize it—for example, through the ability to call custom monitoring scripts for monitoring and remediation. As such, it’s vital that access to the EventSentry management console and configuration is monitored and restricted via Windows permissions. By default, EventSentry:
* only gives local Administrators access to the configuration
* logs every launching of the management console
* logs every time the configuration is changed
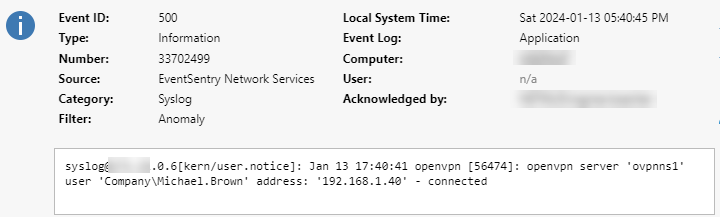
* agents log an event when a new configuration is applied

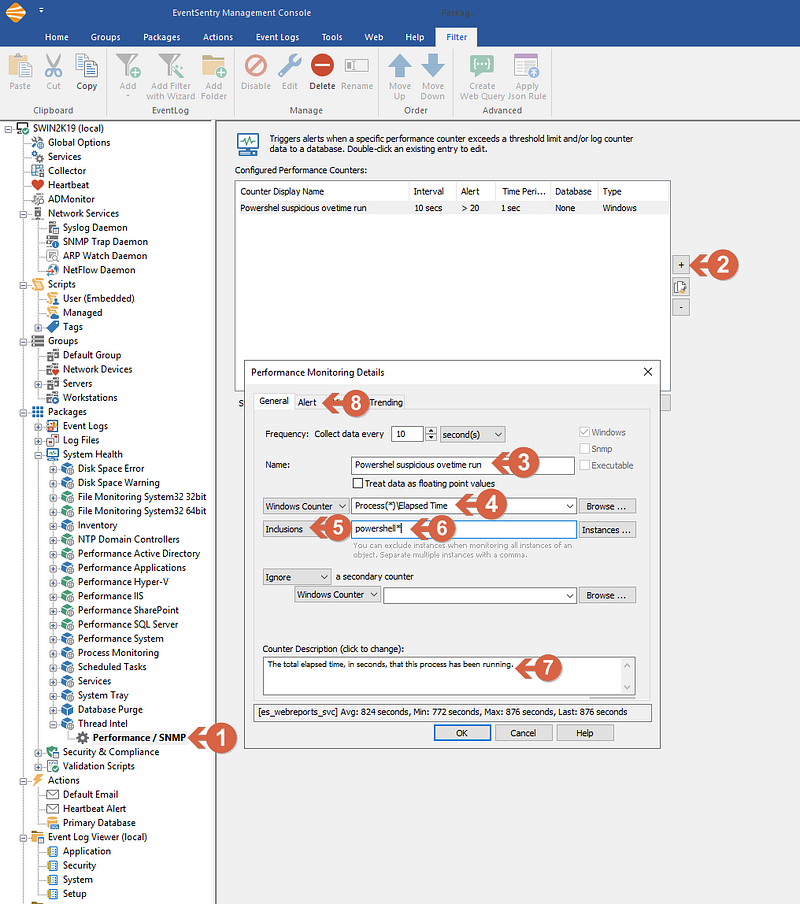
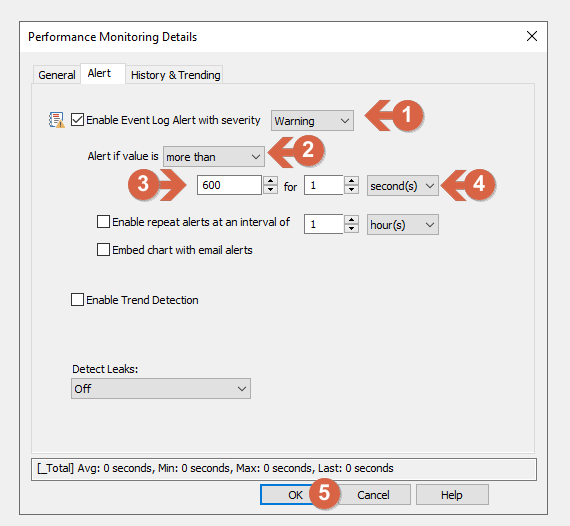
Nevertheless, bugs in user-mode software can still negatively impact a monitored system. For example, a user-mode process can use up all CPU time or exhaust all available memory, slowly causing a system crash. User-mode processes can also impact the kernel indirectly, for example, by opening (and not closing) extremely large numbers of thread handles that are allocated in the kernel nonpaged pool.
Exhausting the nonpaged pool (which can only be stored in physical RAM) can also cause a BSOD. For example, the C++ code below, when executed on a system, will slowly bring it to its knees until it’s either unresponsive or crashed. Windows Server has no built-in protections to prevent this from happening.
unsigned int ThreadTest(void *dummy)
{
while (1)
{ Sleep(1000); }
}
int main(int argc, char **argv)
{
std::vector<HANDLE> threadHandles;
while (true)
{
HANDLE hThread = CreateThread(NULL, 10240, (LPTHREAD_START_ROUTINE)ThreadTest, NULL, 0, NULL);
if (hThread != NULL)
threadHandles.push_back(hThread);
}
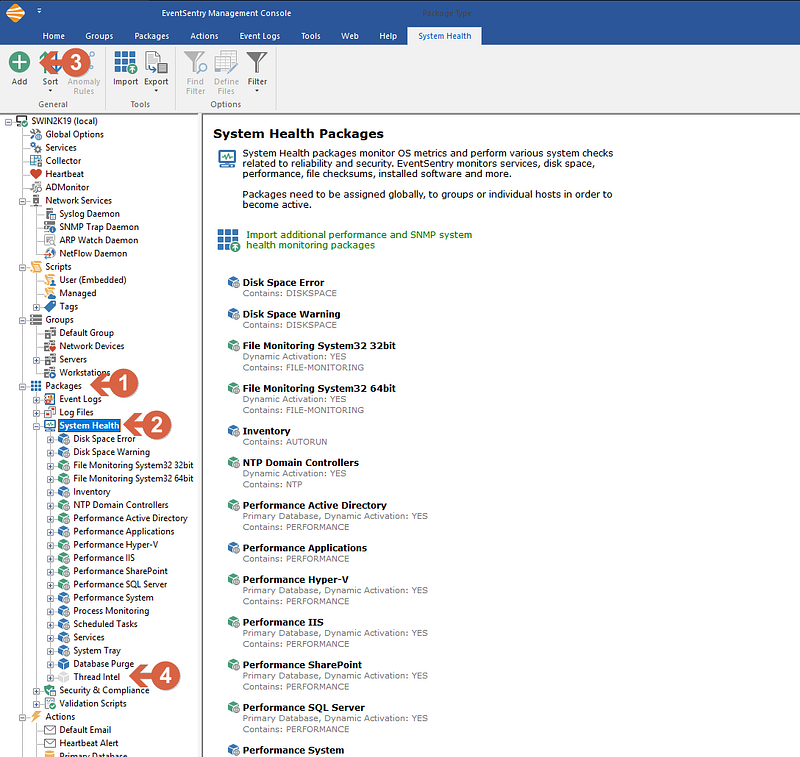
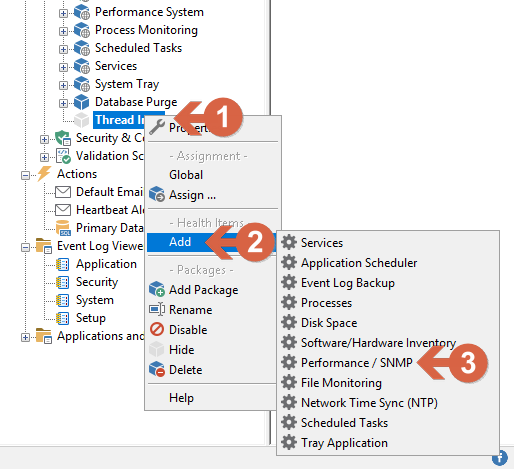
}These type of “subtle” bug takes time, however, and EventSentry’s extensive performance monitoring features would detect such abnormal resource usage on a monitored system in various ways.
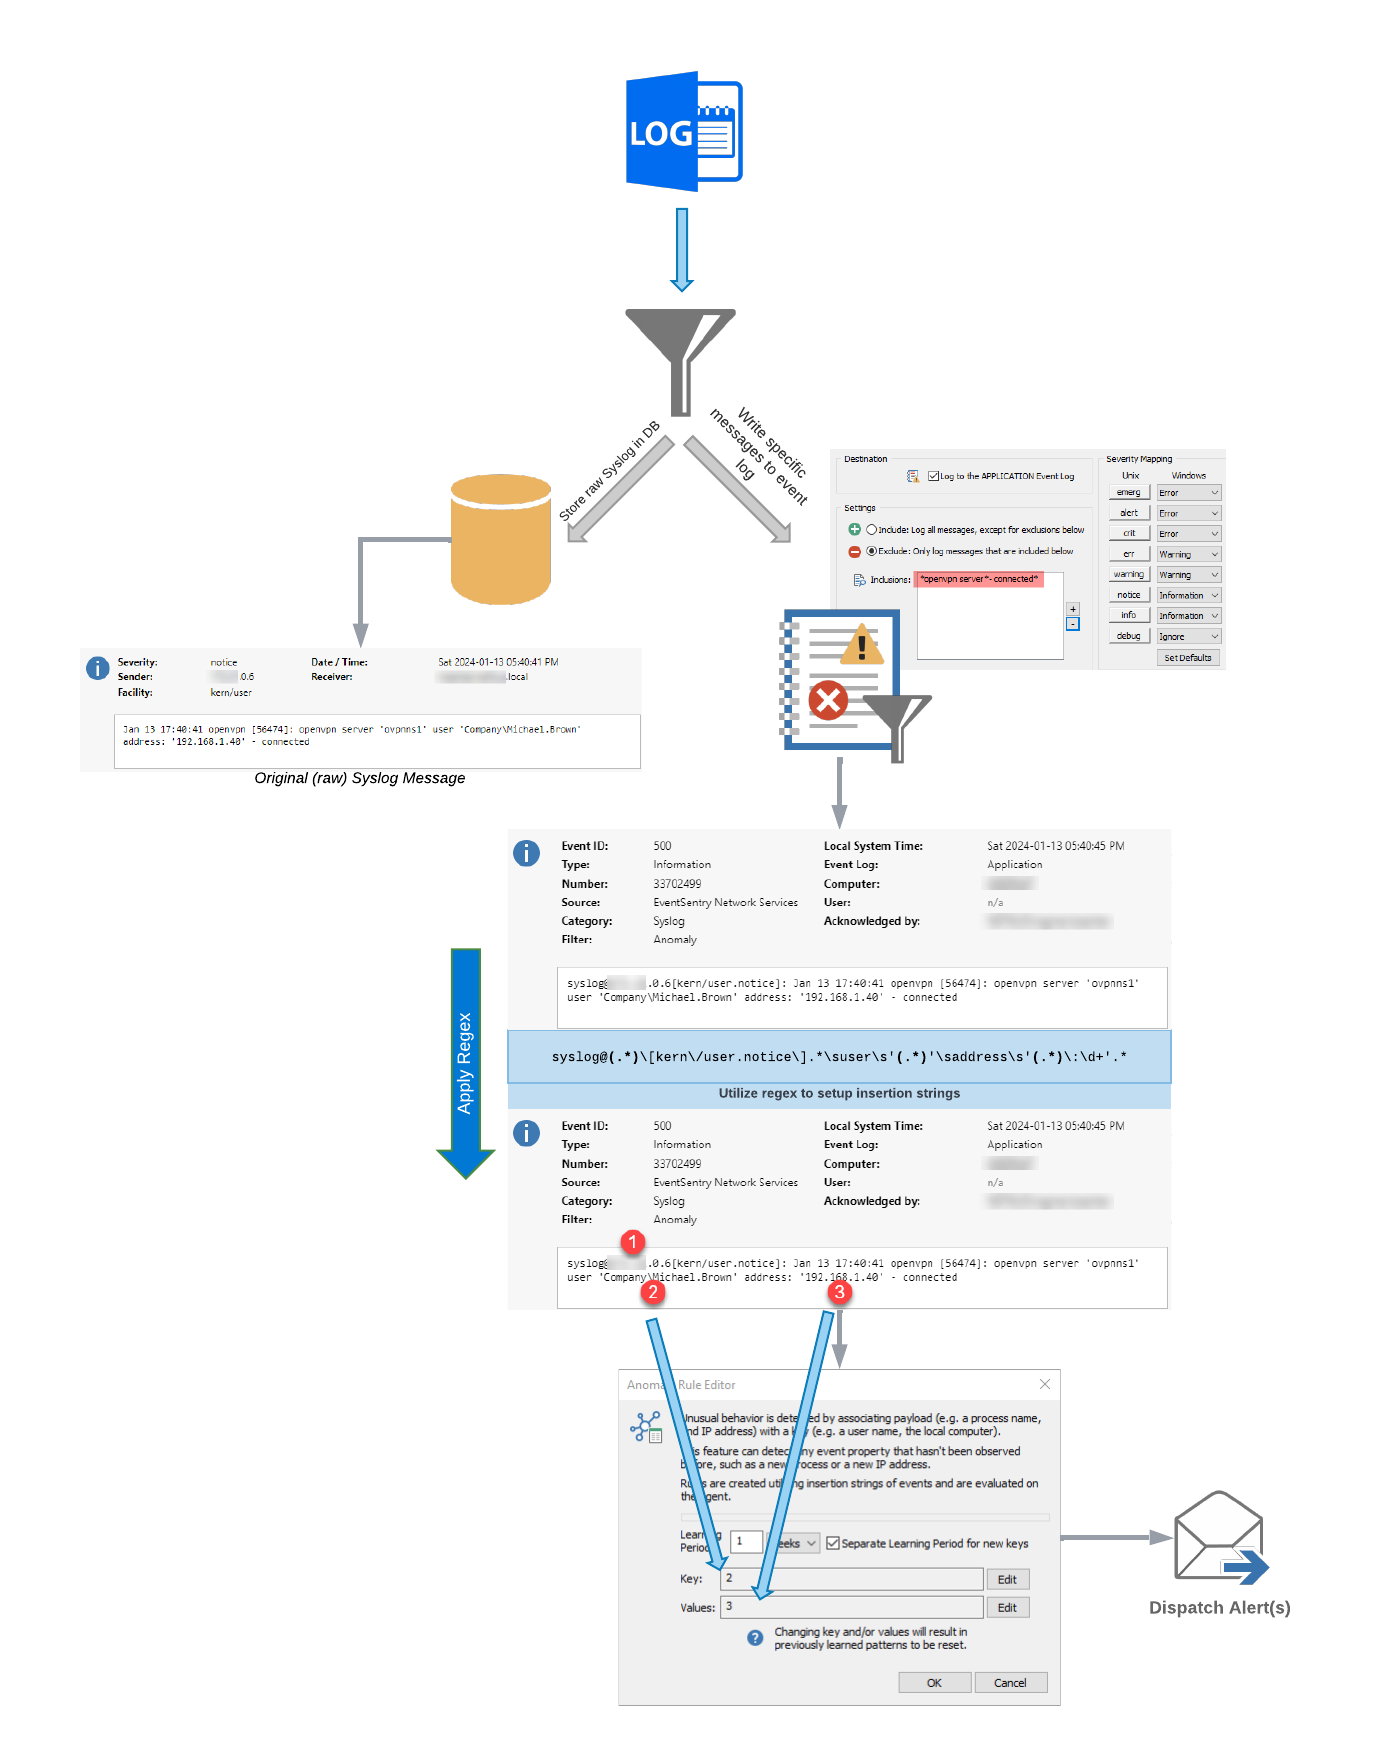
EventSentry also doesn’t use content files like CrowdStrike does. Instead, rules are shipped through package updates which:
* Do not get shipped automatically and require the user to open the management console.
* Do not have the ability to crash the agent or the system.
It’s important to understand that developing software products—especially when used within the increasingly complicated Windows ecosystem—is a complex and intricate process. Supporting multiple platforms, languages, options, and configurations further complicates it. While it’s unfortunately impossible to write perfect, bug-free software, working only with experienced developers and utilizing both automated and manual testing procedures can minimize the risk of disruptive bugs without affecting the evolution of the software product.
CrowdStrike’s Falcon sensor, due to its operation in kernel mode, is both a powerful and high-risk software product—similar to hardware drivers. It appears that CrowdStrike’s QA efforts for its “Rapid Response Content” were not proportional to the risk posed by the Falcon sensor, with extensive QA being applied only to Falcon sensor software updates. It is surprising and disappointing that a large software corporation like CrowdStrike, which sells an expensive software product, did not anticipate this risk ahead of time and instead offloaded the risk to its users. Software vendors can all learn from this disconnect and expand their QA efforts beyond just software code.
Adding insult to injury is the fact that the current CEO of CrowdStrike, George Kurtz, was CTO of McAfee when that software also crippled millions of computers back in 2010. It did this by marking a core Windows executable – svchost.exe – as being infected with a virus and deleting it.