Capturing network traffic is usually done either for security reasons or to troubleshoot networking issues. But by the time you initiate a network capture (either manually or automatically) it’s often too late already – the train has already left the station.
Point in case: Say your SIEM (obviously EventSentry) detects abnormal or suspicious behavior in a log and a network capture is initiated. By the time the capture is started, the most relevant network traffic will likely have already occurred. The same applies to network problems – they are often spurious and starting a capture when you notice the issue will often be too late.
So what can you do? Capturing – and storing – network traffic on a regular basis is often not feasible due to the large amounts of data generated. Permanently writing all network traffic to disks (even if you were to rotate the collected pcap files) creates an enormous amount of disk I/O – something to avoid especially on SSD drives.
But what if you could – at any time – simply dump the last 100 Mb (or more …) worth of network packets with a single command to a .pcap file? Instead of installing or starting an app like Wireshark manually and initiating a capture, you simply issue a single command and done. What’s even better is that it dumps the last 100 Mb of data traffic – you’re capturing the past!
Well, now you can do exactly that with the EventSentry Network Capture service, a new component that is part of the free EventSentry SysAdmin Tools. This service continuously captures all network traffic in a memory-based ring buffer in the background (the size of the buffer is configurable) and dumps the captured network packets to a directory when needed. Better yet, the service is extremely light on resources and uses <1% of CPU time, no permanent disk I/O and most of its memory usage is for the network packet buffer.
The service is easily customized via command line parameters and logs all relevant information to the application event log.
The service does require that a Winpcap-compatible network driver (e.g. npcap) is installed. Out of the box it uses a 50 Mb memory buffer, capturing traffic on the first active NIC with a valid IP address. The default location for .pcap files is the %TEMP% directory.
NOTE: If you already have an earlier version of the EventSentry SysAdmin Tools installed, then you’ll need to uninstall & reinstall to see the new component in the installer.
Install the EventSentry SysAdmin Tools and make sure the optional EventSentry Network Capture service is checked
Review & customize settings
Once everything is setup, simply run a single command to capture the most recent network traffic.
If the dump was successful, event id 120 will be immediately logged to the Application event log:
This is also useful on systems where you frequently need to capture network traffic. Instead of loading up an app like Wireshark and waiting, simply dump the buffer and you’re done!
Anybody who monitors logs of any kinds, knows that the extracting useful information from the gigabytes of data being collected remains one of the biggest challenges. One of the more important metrics to keep an eye on are all sorts of logons that occur in your network – especially if they originate on the Internet – such as VPN logins.
With the introduction of Anomaly Detection in EventSentry v5.1, filtering out suspicious activity – such as logons from previously unknown users or IP addresses – is now possible and can mean the difference between missing or detecting a malicious logon that could wreak a lot of havoc on your network.
What’s unique about EventSentry’s anomaly detection is that it works any type of data – whether it’s from an event (e.g. Windows logon), a log file (e.g. HTTP log) or a Syslog message (e.g. VPN login). As long as the data you are capturing follows a pattern that can be mapped to a regular expression (RegEx), anomaly detection should be able to analyze and report on it. And the best part EventSentry’s anomaly detection is that it works in real-time – alerts about suspicious activity are usually generated within seconds of the event occurring.
Since pfSense firewalls are popular and free, we’ll look at VPN logins in this example. Again, this technique can be applied to any other product, as long as it logs or sends activity to EventSentry and includes both a username and IP address in a single message. Now, let’s cut to the chase and start with the message the pfSense firewall sends when a user logs on:
Jan 13 20:36:00 openvpn[53530]: openvpn server 'ovpns1' user 'domain\username' address '25.22.29.248:12377' - connected
The goal of this exercise is to determine when a user (successfully) logs on from a different IP address, e.g. when their credentials have been compromised. By establishing a baseline and linking usernames to IP addresses, we can flag any previously unseen IP address as suspicious and investigate. This is of course the same concept we apply to other activity on your network – previously unseen processes, logons and so forth.
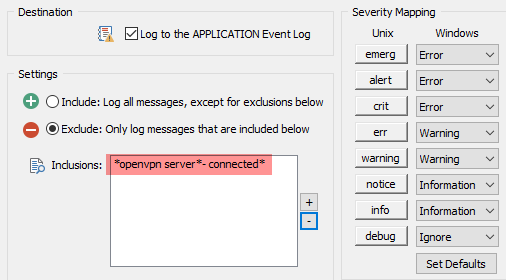
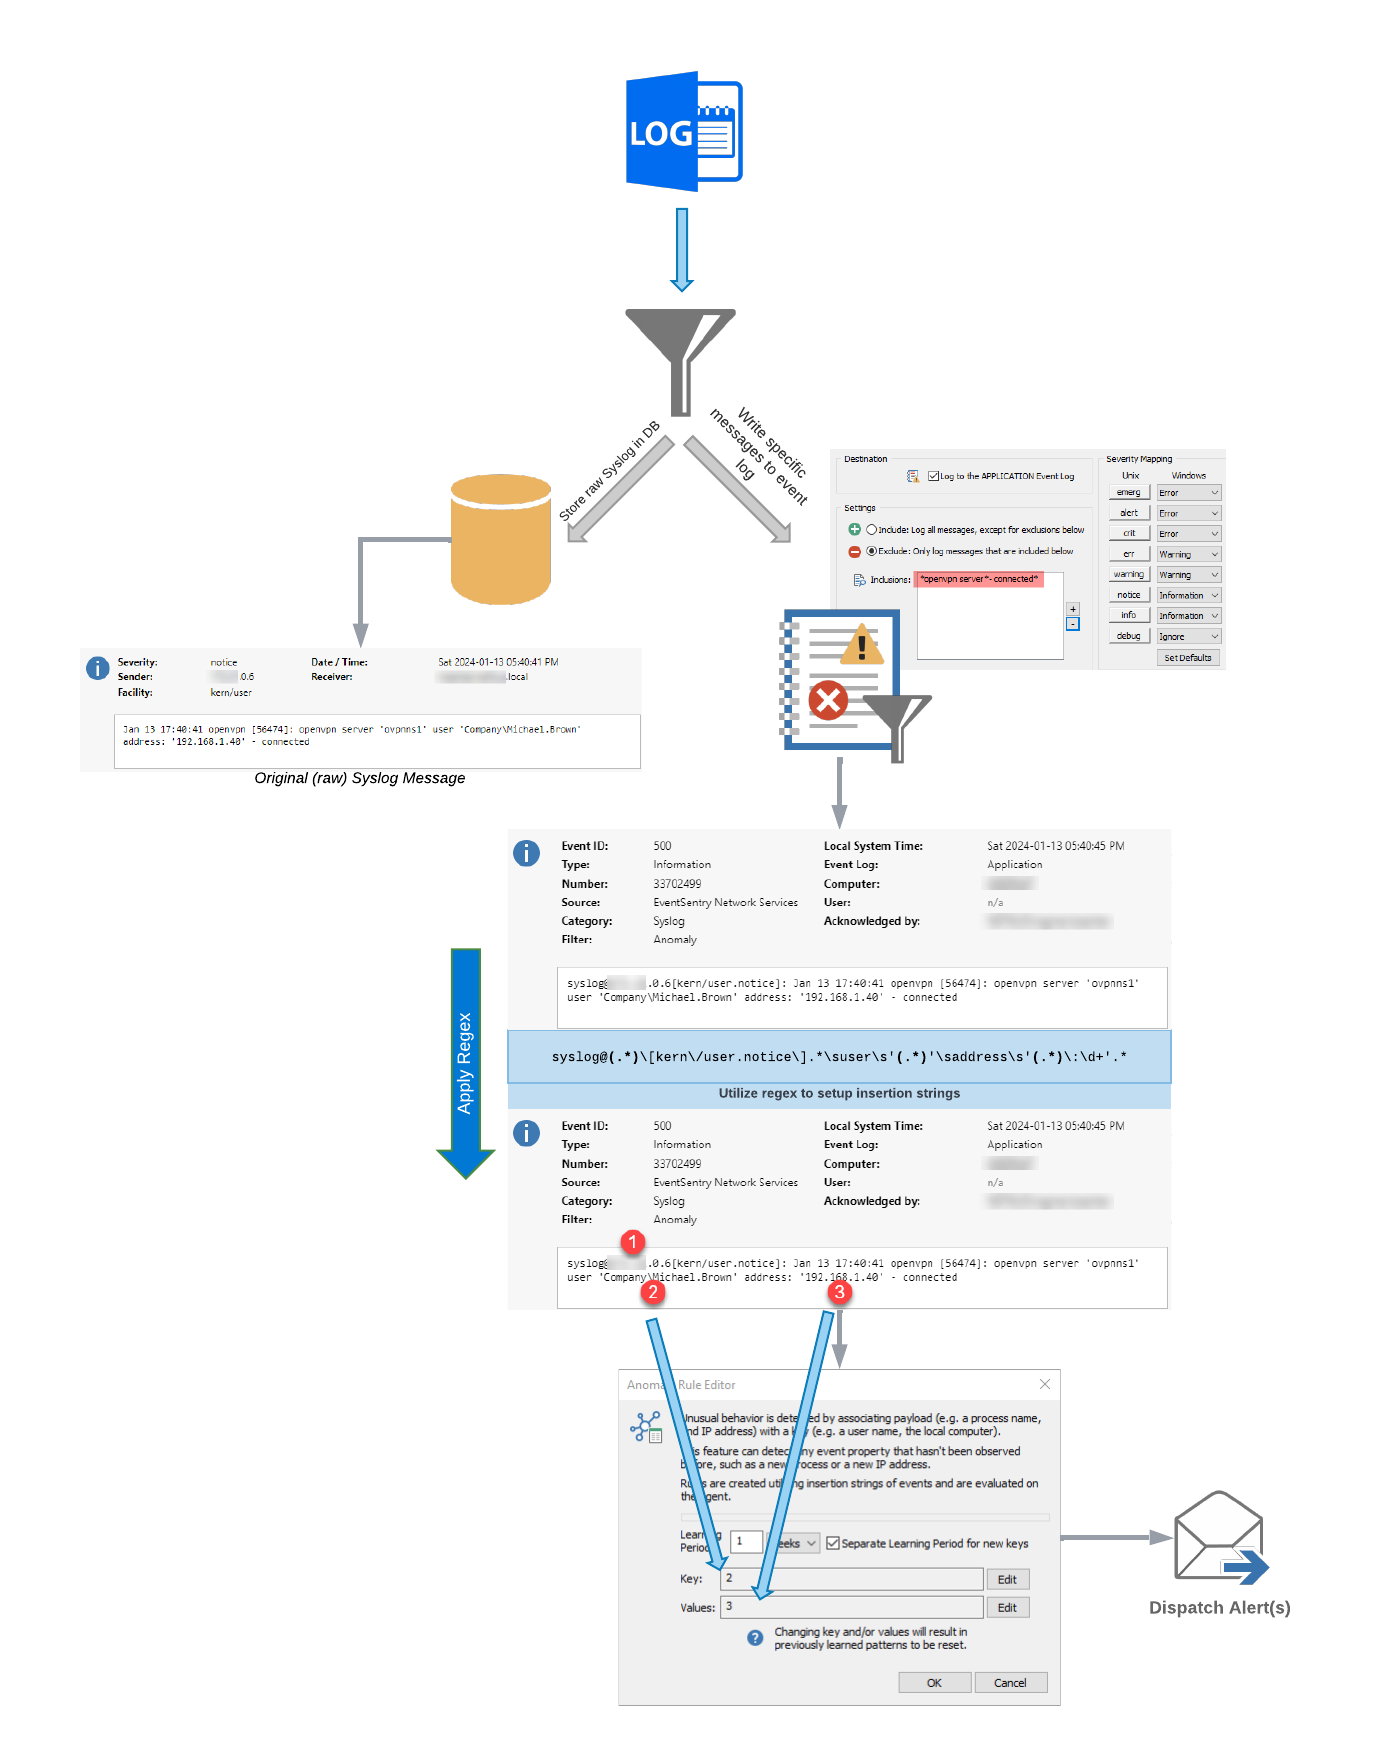
Back to our VPN message from pfSense. EventSentry supports writing select Syslog messages to the event log, something we’ll have to do in order for the anomaly detection to work. This is configured in the Syslog component of EventSentry’s Network Services, as shown in the screenshot below. You may already have this enabled on your network in which case you would want to add the highlighted line, but if you don’t then simply enable this:
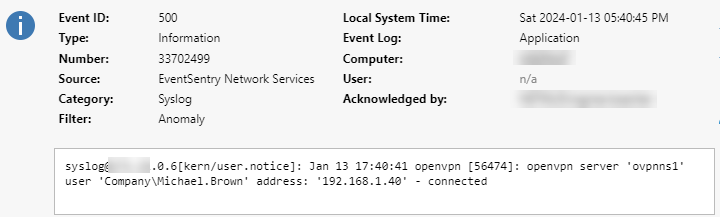
Once enabled, EventSentry will log any Syslog message that matches any of the listed patterns to the event log with event id 500, similar to what’s shown below:
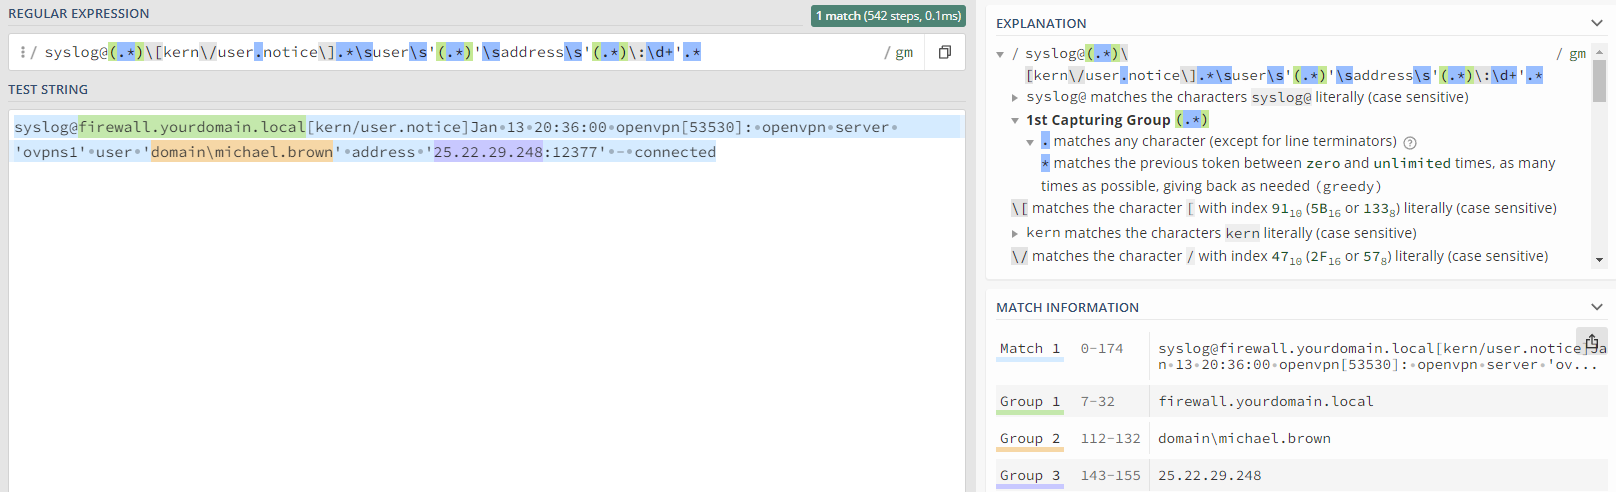
The message logged to the event log is almost identical to the message sent by pfSense, except that EventSentry adds some metadata to indicate where the message was sent from along with the associated facility/severity. Using the regular expression
we can extract the sender, username and IP address. As a reminder, you can experiment with regular expressions on regex101.com as shown below:
Advanced users can also test the regular expression in the management console, but the regex101 web site provides more feedback that can be helpful when troubleshooting. By creating an event log filter which looks for these Syslog events and applies the regex, the event can then be used as input for the anomaly engine, since it relies solely on insertion strings which are not present in Syslog events by default (technically they are, but not in the format that would be needed).
Note: Even though the filter is an Anomaly filter, the filter type will have to be temporarily set to Include so that the regular expression can be configured in the Advanced dialog. It’s a good idea to test the filter with live data before configuring the Anomaly settings – to ensure that the event you are trying to process matches your filter rule.
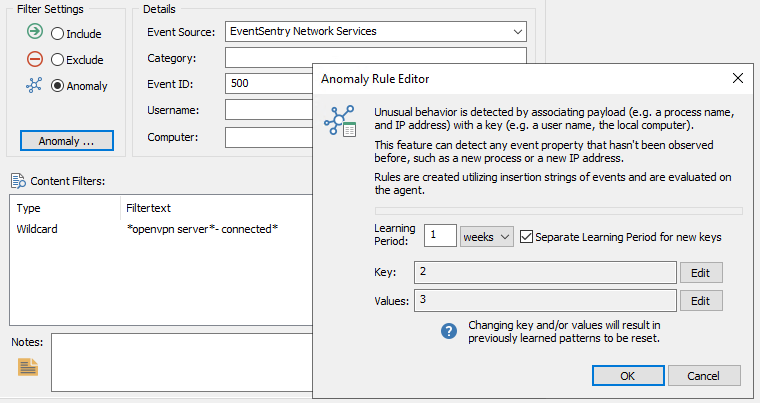
With the regular expression override configured, the filter can now be configured for anomalies, using insertion string #2 (the username) as the key, and insertion string #3 (the IP address) as the value. The configuration in the management console should look similar to what is shown below:
As shown in the screenshot above, the filter matches Syslog events from the openvpn server and creates anomaly patterns based on the username and IP address, with a learning period of 1 week.
This means that when a new key (=username) is encountered, the value (=IP address) is recorded and the learning period (1 week) starts. During the learning period, events from the same user are not marked as anomalies and the first and future IP address during the learning period are associated with the username. After the learning period, any new IP address reported will be considered an anomaly.
To summarize, the overall flow of events is shown in the diagram below again:
The final step is to create another filter which will perform the desired notification action when an anomaly is found. This step can be skipped if a method for reporting on anomalies is already present, for example:
Require an acknowledgement in the web reports (see below)
Send an email notification
Open a ticket
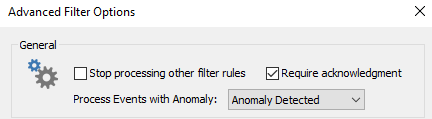
The screenshot below shows the advanced filter settings necessary to require an acknowledgement from anomaly events:
This approach can be used to detect anomalies with a variety of inputs, whether the data comes directly from the event log or from an auxiliary data source like Syslog or a log file. As long as the source can be normalized into data pairs that can be fed into the anomaly engine, suspicious network activity can be detected in real time with EventSentry.
We’re extremely excited to announce the availability of the EventSentry v5.1, which will detect threats and suspicious behavior more effectively – while also providing users with additional reports and dashboards for CMMC and TISAX compliance. The usability of EventSentry was also improved across the board, making it easier to use, manage and maintain EventSentry on a day-by-day basis.
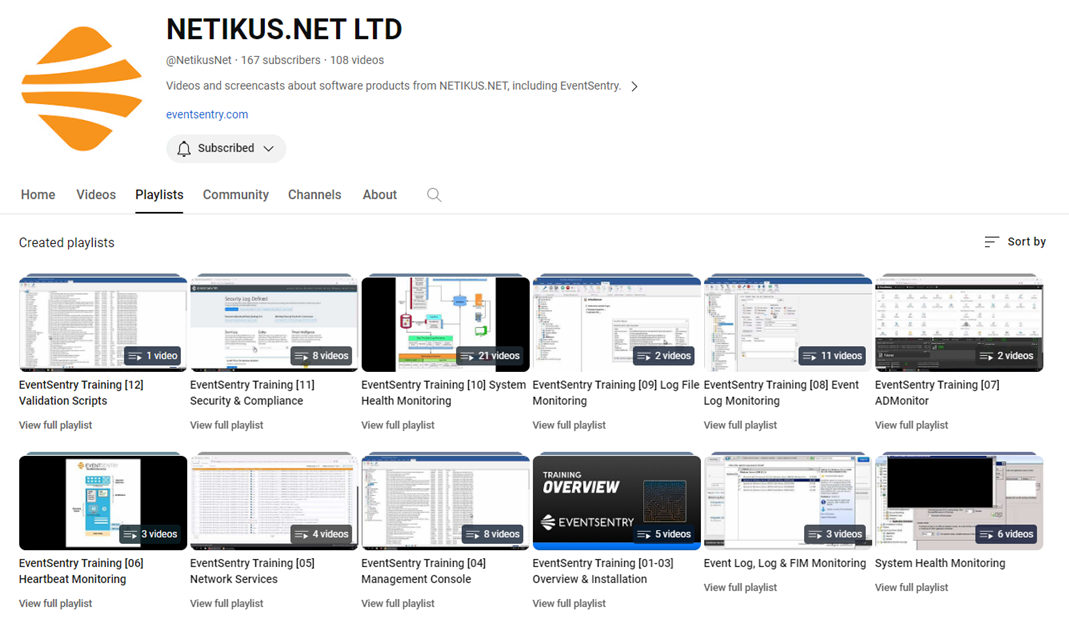
We also released 60+ training videos to help you get started and take EventSentry to the next level. The videos will be available to everyone for free both on YouTube and in your account area.
Anomaly Detection
One of the best real-time event log monitoring engines got a lot smarter in v5.1 and can now detect unusual behavior like the following:
A user who never logged on to a server/workstation
A user connects from a remote IP from which he/she usually doesn’t normally connect from
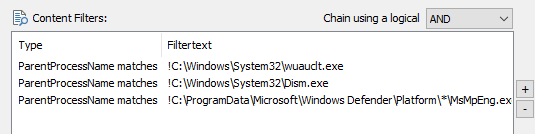
A previously unknown process starts
A process loads a DLL it has never loaded before (requires Sysmon)
But the best part about the new Anomaly detection is that it’s customizable – so anybody can create their own anomaly rules based on their needs.
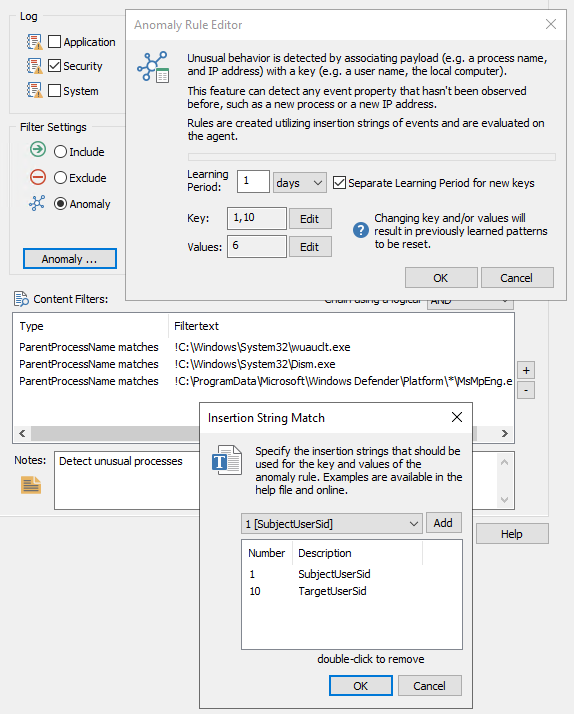
Anomaly filters utilize insertion strings of events, so they work best with well-formatted events from the security or Sysmon event logs.
EventSentry ships with a number of built-in anomaly filters, but watch the official training video to understand how anomaly filters work to create your own.
Database Maintenance & Web-Based DB Maintenance Jobs
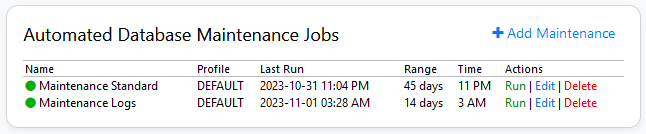
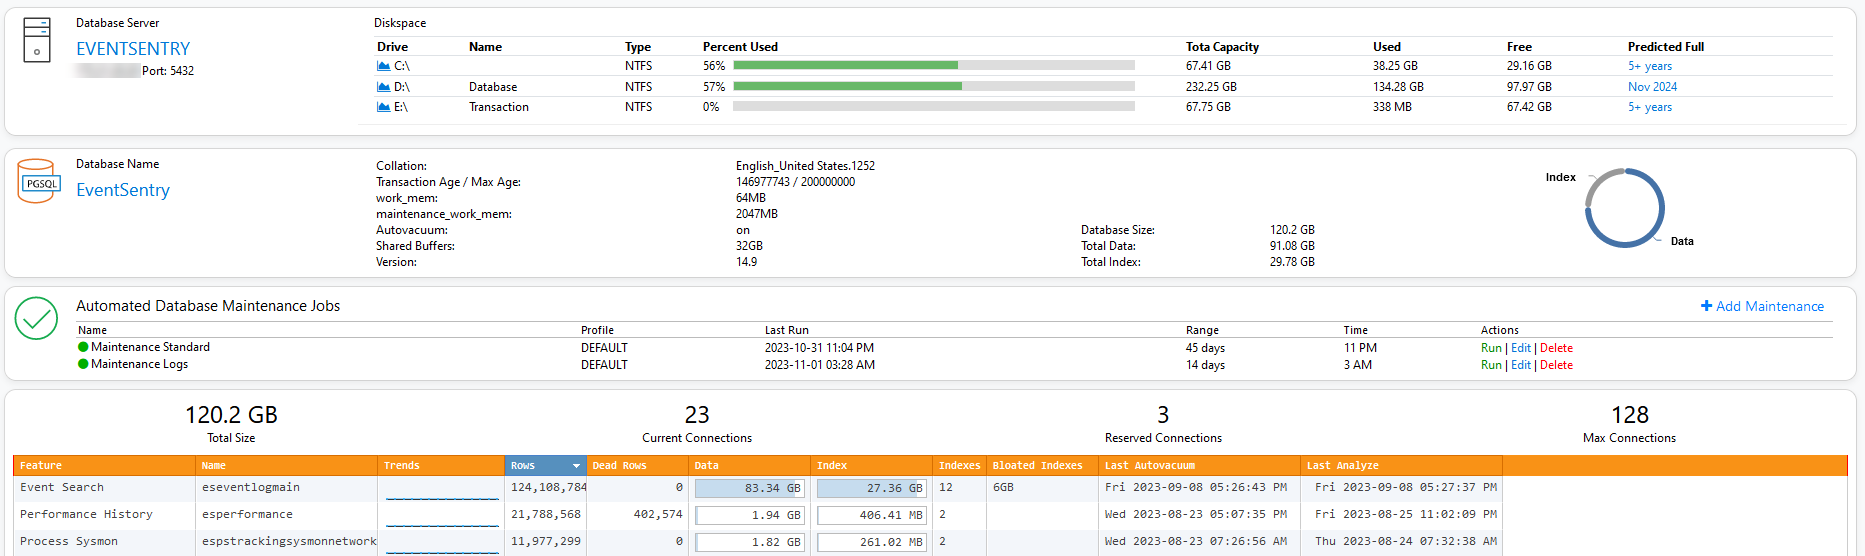
Also new is the ability to schedule database maintenance jobs directly from the web reports – so it’s no longer necessary to create or edit (embedded) scripts, application or task schedulers just to keep your database size in check. Simply schedule a job in the web reports and review the results after the job completed. The maintenance jobs themselves have also been improved and will attempt to free up disk space after each purge cycle when using the built-in database.
We’ve also improved the database usage page, which now shows significantly more details about the database health, including trends to help identify features that are growing in size.
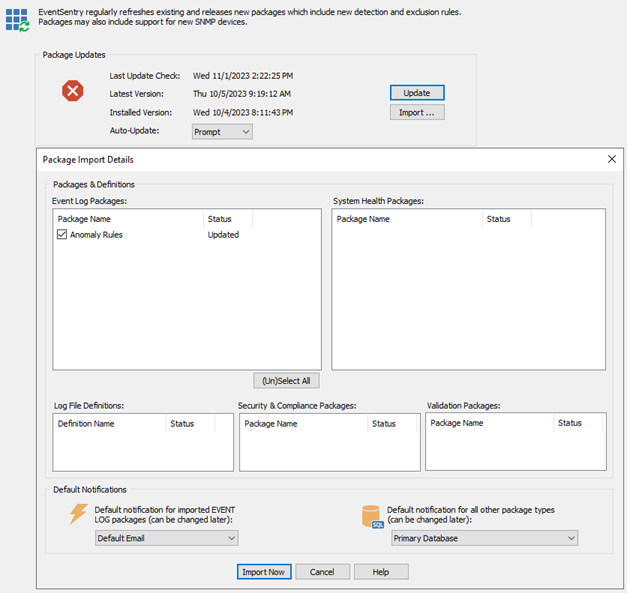
Dynamic Package Updates
Unlike validation scripts, which (can) automagically update in the background so you can enjoy the latest checks with the click of a button, package updates have been a bit slower and more clunky. But this is all in the past, as package updates use the same update engine like our popular validation scripts, and can now seamlessly keep select packages up to date.
As such, users with active maintenance agreements can expect a lot more package updates to be made available to help you detect and defend against emerging threats. This new functionality also allows you to apply filters rules in JSON format directly into the management console, e.g. from KB articles or blog posts.
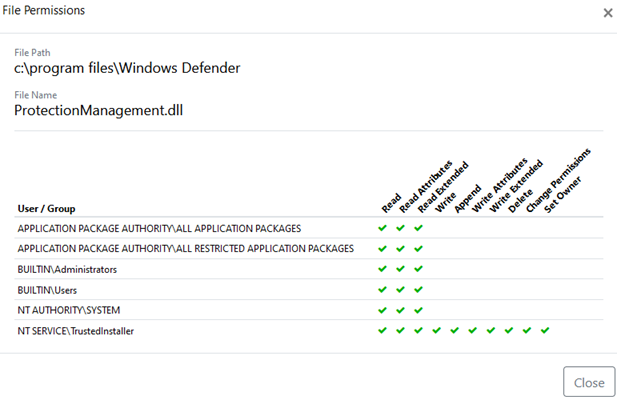
Permission Inventory
Keeping NTFS file permissions clean and updated can be a tedious task, even when you follow best practices (e.g. create groups for each file share and assign permissions to those groups), it can be quite difficult to stay on top of all file shares and folders, especially in medium and large-sized networks.
To which files and folders does a user have access? Who has access to critical folders?
EventSentry’s new permission inventory enumerates configured folders and their permissions (on a configurable schedule – e.g. daily), and presents them in the familiar Summary/Detailed view, making it straightforward to answer exactly those questions.
Every database-enabled feature in EventSentry can now store data in multiple databases, something that was previously only available in select features. This will make it easier to store all collected data in an active as well as an archive database simultaneously.
ADMonitor can now send data through the collector, the only component in EventSentry that did previously not have support for the collector.
EventSentray
EventSentray now also shows the network utilization and sports a useful “Internet Test” dialog which can test various aspects of your Internet connection – something that’s especially handy for mobile endpoints (aka “laptops”). The official training video has more information on EventSentray and how to configure & deploy it.
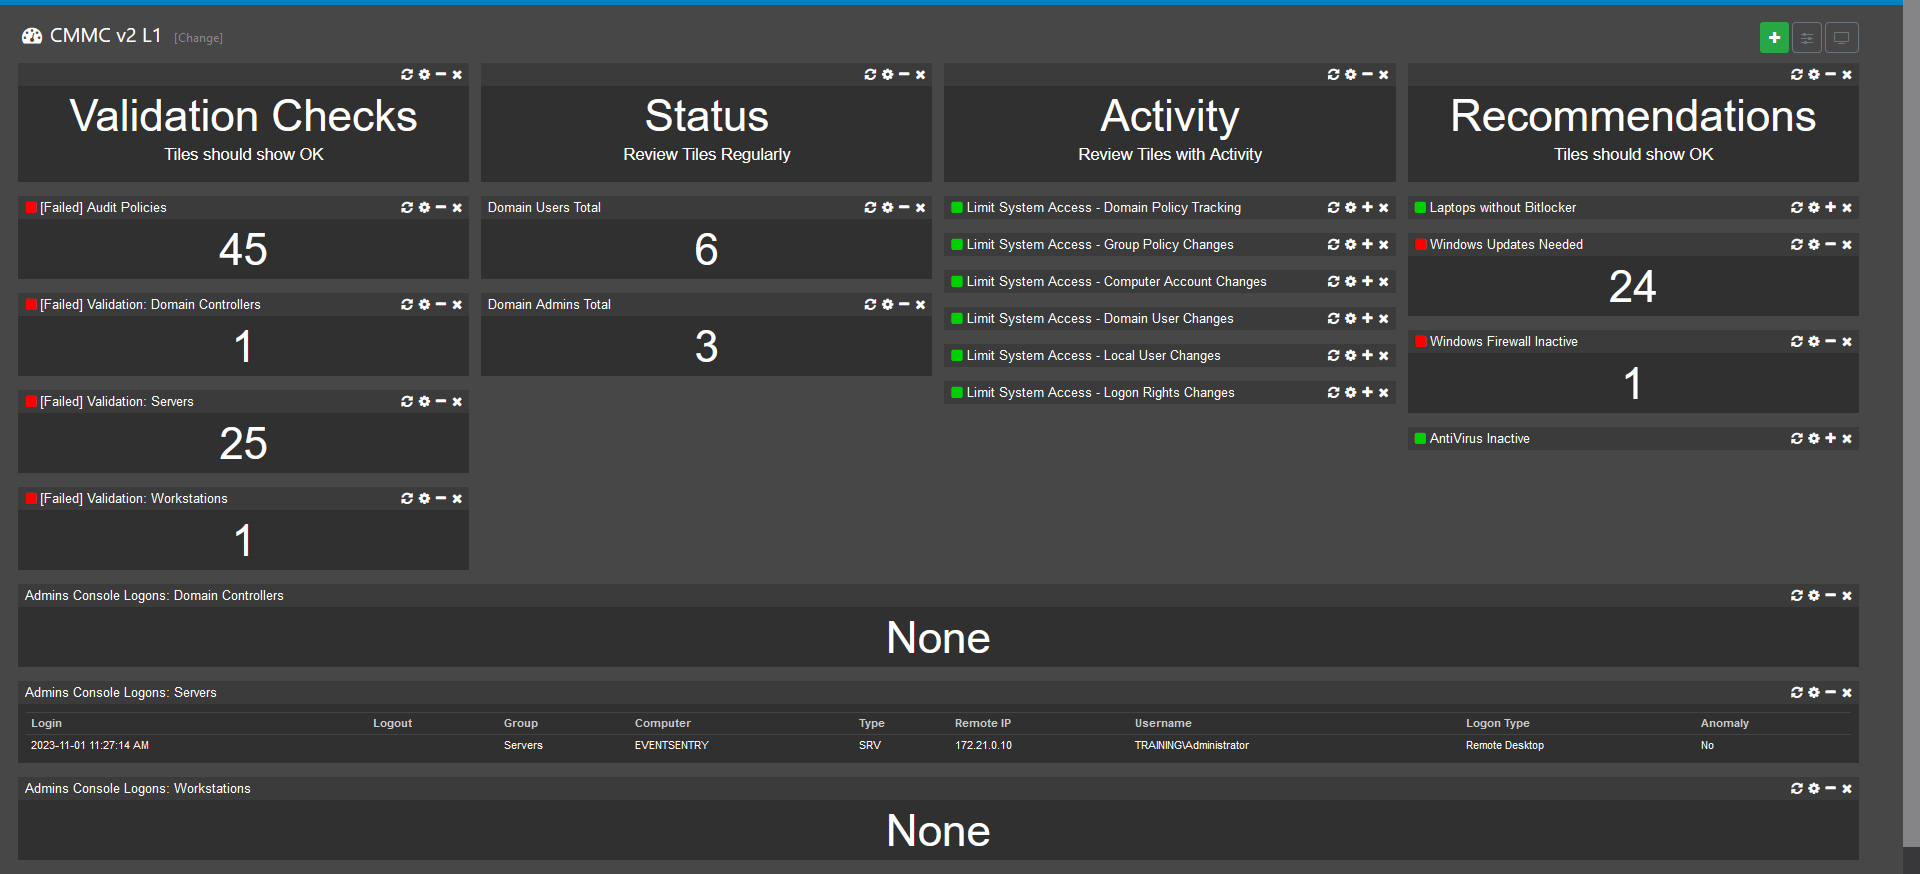
Compliance
Compliance requirements like CMMC, PCI, HIPAA, NIST and others continue to evolve and affect more and more companies. As important as compliance frameworks are with providing structure and guidance, companies often find it difficult to apply what are often vague rules and requirements.
Our new CMMC v2 and TISAX reports/dashboards bring together many features in EventSentry and provide a real-time status and overview of your compliance status. And our new dashboards provide actionable data that can be used to increase the security of your network – not just check boxes.
Usability Improvements
While every EventSentry release tends to incorporate little tweaks and improvements, v5.1 features many usability and troubleshooting enhancements:
Insertion strings in filters (when available) now show the name of the string instead of just the number, making it a lot easier to create and manage complex filters.
The “Save Configuration” prompt in the management console would often be displayed even when no changes were made. This has been improved significantly and you should see this prompt much less often in v5.1, with more improvements planned in future versions.
A new “GoTo” button will jump to any item in the tree that contains the specified text.
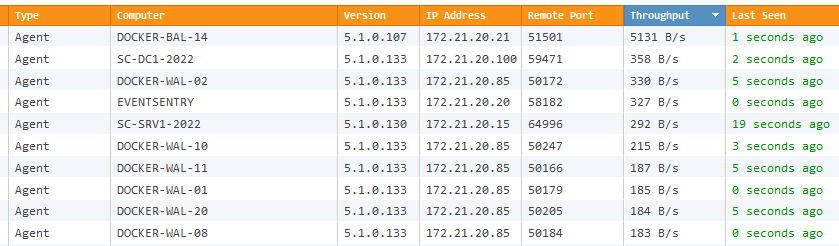
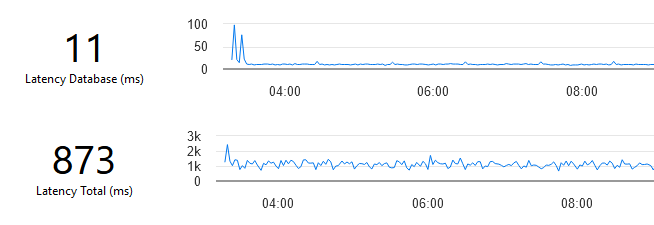
Collector users can see collector health right in the management console without having to access the web reports, while the collector status page in the web reports also shows the collector latency and throughput of individual agents.
EventSentry Training
In addition to a EventSentry’s comprehensive documentation all users now have access to a 60+ free training videos – with a total runtime of over 10 hours – organized into playlists. All videos are accessible on our YouTube channel in the Playlists section, with a training section on eventsentry.com coming soon as well. We highly encourage you to browse the new training videos – they are useful for new users and experienced users of EventSentry alike. Please upvote videos you enjoyed, we’re also happy for any feedback!
I think we’ve all been there before – you log on to a server remotely via RDP, and do the needful – but don’t immediately log off. But then you get distracted by a phone call, an email, a chat, or a good old-fashioned physical interaction with another human being. So when it comes time clock out for the night, you shut down your computer or log off. Or maybe you’ve been working on a laptop and your VPN got interrupted. The result is the same – previously active RDP sessions are automatically disconnected. Or maybe one (not you, of course) purposely disconnects their session so that the next login process is faster.
Well whatever may be the reason, a key issue with disconnected RDP sessions is that, by default, they remain connected indefinitely until the server gets rebooted, you login again (because you forgot to do something?), or a coworker notices the offense and politely requests you log off.
At this point you’re probably thinking “OK, yes, but who really cares“? With all the serious stuff that’s going on around you, you’re probably wondering why the heck you suddenly need to worry about disconnected RDP sessions? Well, disconnected RDP sessions can be problematic for a number of reasons:
Potential Issues
Confusion
It can be confusing when you’re logging on to a server and notice that another user is logged on, even if it’s just a disconnected session. Are they doing important stuff? Can the other user by logged off? Or you’re trying to reboot a server, but the infamous “Other users are currently logged on … ” message pops up. Assuming you’re polite, you’ll reach out to the disconnected fellow to ensure that the user isn’t running any important apps. In short, it’s a pain. And we all have enough pain as it is, do we not?
Security
So this is the fun one and, I admit, the real reason for this blog post (no, it was not the confusion). Turns out that any local administrator has the ability to hijack any disconnected session on the server he or she is an administrator on. And while this doesn’t sound like a huge problem at first (if the user is already an admin, then he can do anything blah blah), there is a very specific scenario where this is a significant security risk. Being an admin on a machine is a great privilege, but hardly the key to the kingdom. If a domain admin (or even worse, an Enterprise Admin!) however logs on to the same host and disconnects their session, then the local admin can promote himself/herself to domain admin at no cost (EventSentry would of course detect this) by simply taking over the disconnected session. The process involves only a handful of commands, one of which is creating a temporary service (EventSentry would detect this also).
Resource Consumption
Processes from disconnected sessions do continue to run and consume some processing power, which can be an issue in environments with limited computing power or cloud environments where you pay for CPU time. It’s unlikely to have a large impact but it could add up for larger deployments.
I’m hoping that we can (almost) all agree now that disconnected sessions have a number of drawbacks, so let’s move on to ways to address this.
Solutions
User Education
While there are ways to forcefully log off idle users (see below), I think it’s important to make your admins aware that disconnected sessions pose a security risk, but also communicate to your users in general that disconnected sessions should be avoided when necessary. While this won’t solve the problem entirely, it will hopefully get some of your users to be more aware.
Notifications
EventSentry users can utilize filter timers to get notified when a user has been logged on to a server too long. Those not familiar with filter timers can learn more about them here. In short, filter timers work with events that are usually logged in pairs – such as a process start/process end, logon/logoff, service stop/service start etc – and can notify you when such an event pair is incomplete. For example, a logon is recorded but not followed by a logoff within a certain amount of time (the time period is configurable).
So in this scenario, a user’s logon event would start a filter timer that essentially puts the original event on hold. It won’t forward it to a notification just yet – only if the timer expires and no subsequent event has deleted the timer. A later logoff event (that is linked to the logon event via some property of the event like a login ID) would end the filter timer. If the logoff event does not happen (or happen too late), EventSentry will release the pending (logon) event and can send a notification to let either the team or the user know (if the login pattern matches email addresses) that the filter time has expired.
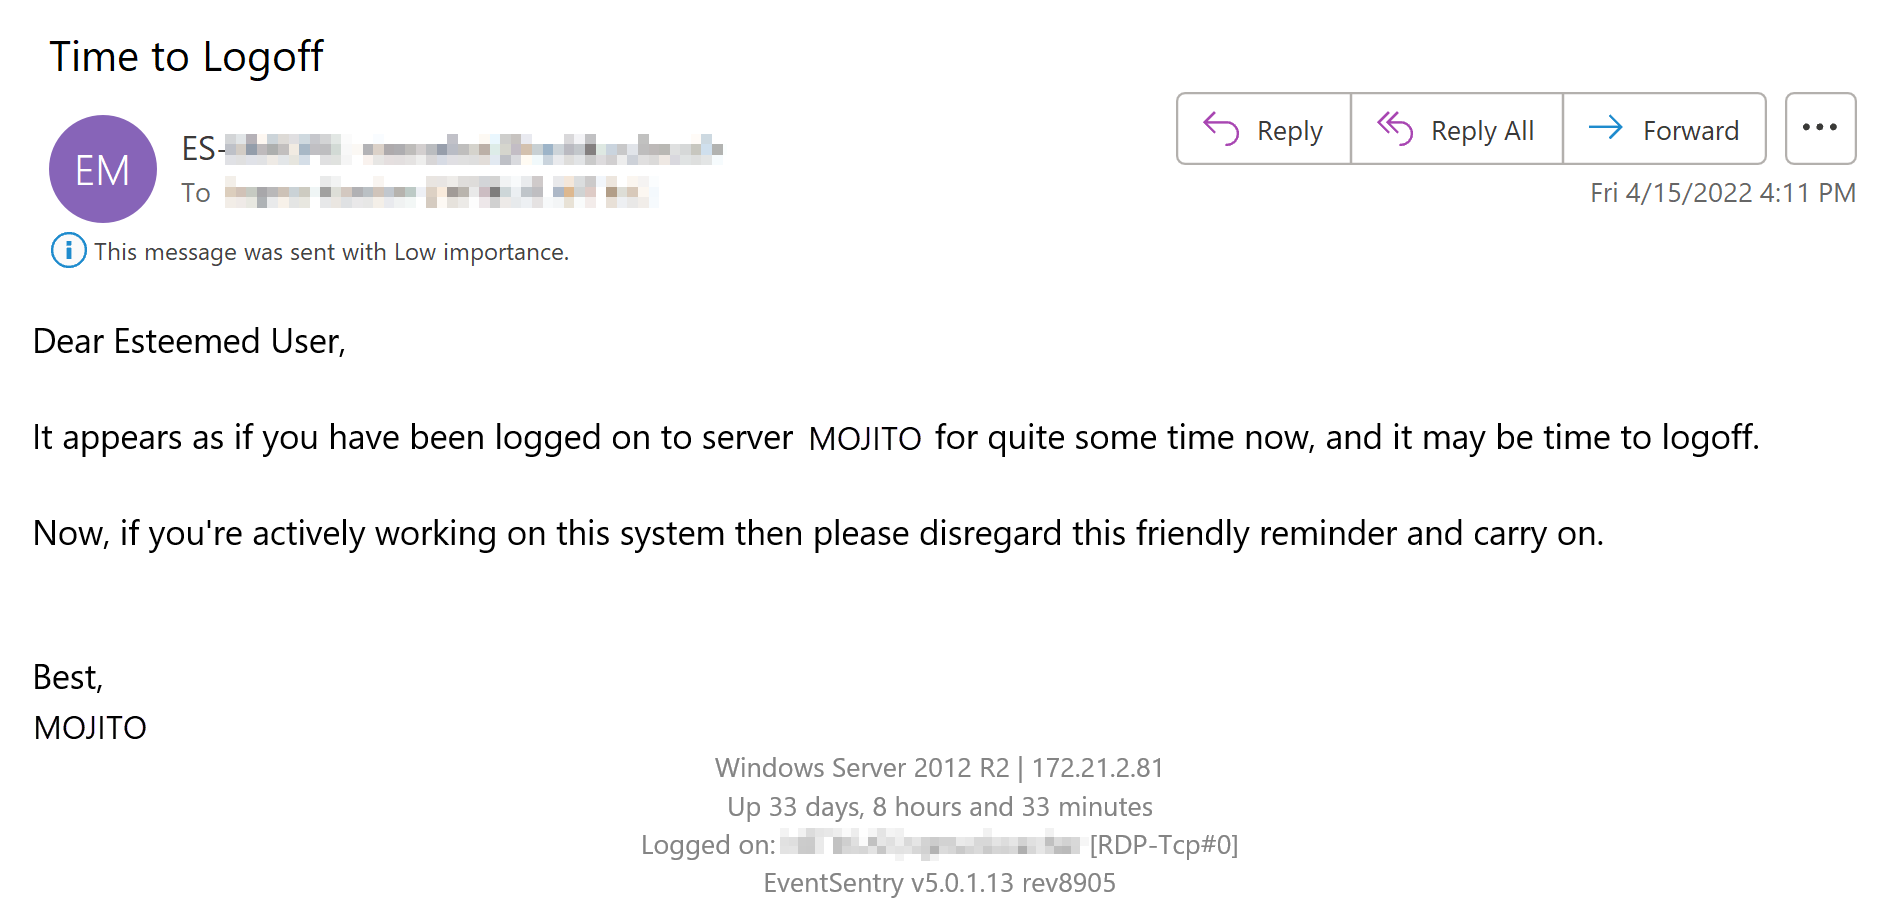
BONUS: If the Windows username can be matched to an email address (e.g. username is john.doe and the email address is john.doe@mycorp.com), then EventSentry can even send an email directly to the user (opposed to a generic email) reminding them to log off. Even better, the email can be customized and provide specific instructions. See KB 465 for instructions on how to configure this in EventSentry. The screenshot below shows such a customized email.
Disclaimer: This method doesn’t necessarily distinguish between users who are logged on and users who have disconnected sessions. It detects that a user has had a Windows session active for an extended time period. In most cases this should work reasonably well to detect disconnected sessions as well. especially with longer timer periods (since most users don’t need to be logged on to a server for many hours).
Forcibly logging off disconnected sessions
When you tried your best the nice way using education and emails and it’s just not working, well, then it turns out that Windows allows you to use the nuclear button – logging off disconnected user sessions after a certain time. Since this can be configured via group policy, implementing this is fairly easy. Simply create a new group policy and assign it to appropriate OU(s) and configure the following setting:
Local Computer Policy
   |-- Computer Configuration
       |-- Administrative Templates
           |-- Windows Components
               |-- Remote Desktop Services
                   |-- Remote Desktop Session Host
                       |-- Session Time Limits
Then simply enable the option and configure an appropriate time limit. The available timeout options are actually quite useful and range from 1 minute (which pretty much converts a disconnect with a logoff) all the way up to 5 days (which is better than nothing I suppose, but why even bother at that point?). What option you select here largely depends on how concerned you are about resource usage and sessions being hijacked. I personally would recommend a lower end of 30 minutes up to 8 hours at the maximum.
Validating RDP settings with EventSentry Validation Scripts
EventSentry includes two validation scripts that validate whether RDP session timeouts are enabled:
Disconnected RDP sessions aren’t an immediate security risk, since they require an intruder to somehow gain admin rights on a domain member machine first. Sophisticated attacks however rarely involve just one step, but usually take advantage of multiple vulnerabilities and exploits. Since there are few to no downsides to notifying or even logging off users after a certain amount of time, I would recommend to follow the recommendations outlined in this blog post.
Monitoring temperature and humidity in a server room are quite important if you want to reduce the risk of expensive equipment failure. Yet, many server rooms either aren’t monitored at all or rely on ancient wall-thermostats that, in case of a problem, only emit desperate beeps that nobody will hear.
There are a lot of environmental sensors available to purchase, but many of these have a number of limitations:
Expensive
Only measure temperature
Don’t support SNMP
Require specific software
No display
Wouldn’t it be nice if you could just create your own, networked environmental sensor that measures both temperature and humidity for around USD 100? In this post we’ll show you how to assemble this apparatus – based on a Raspberry Pi (most models work) – that does all this:
Measures temperature
Measures humidity
Measures light (bonus!)
Networked
Accessible via SNMP
Shows current values on a display
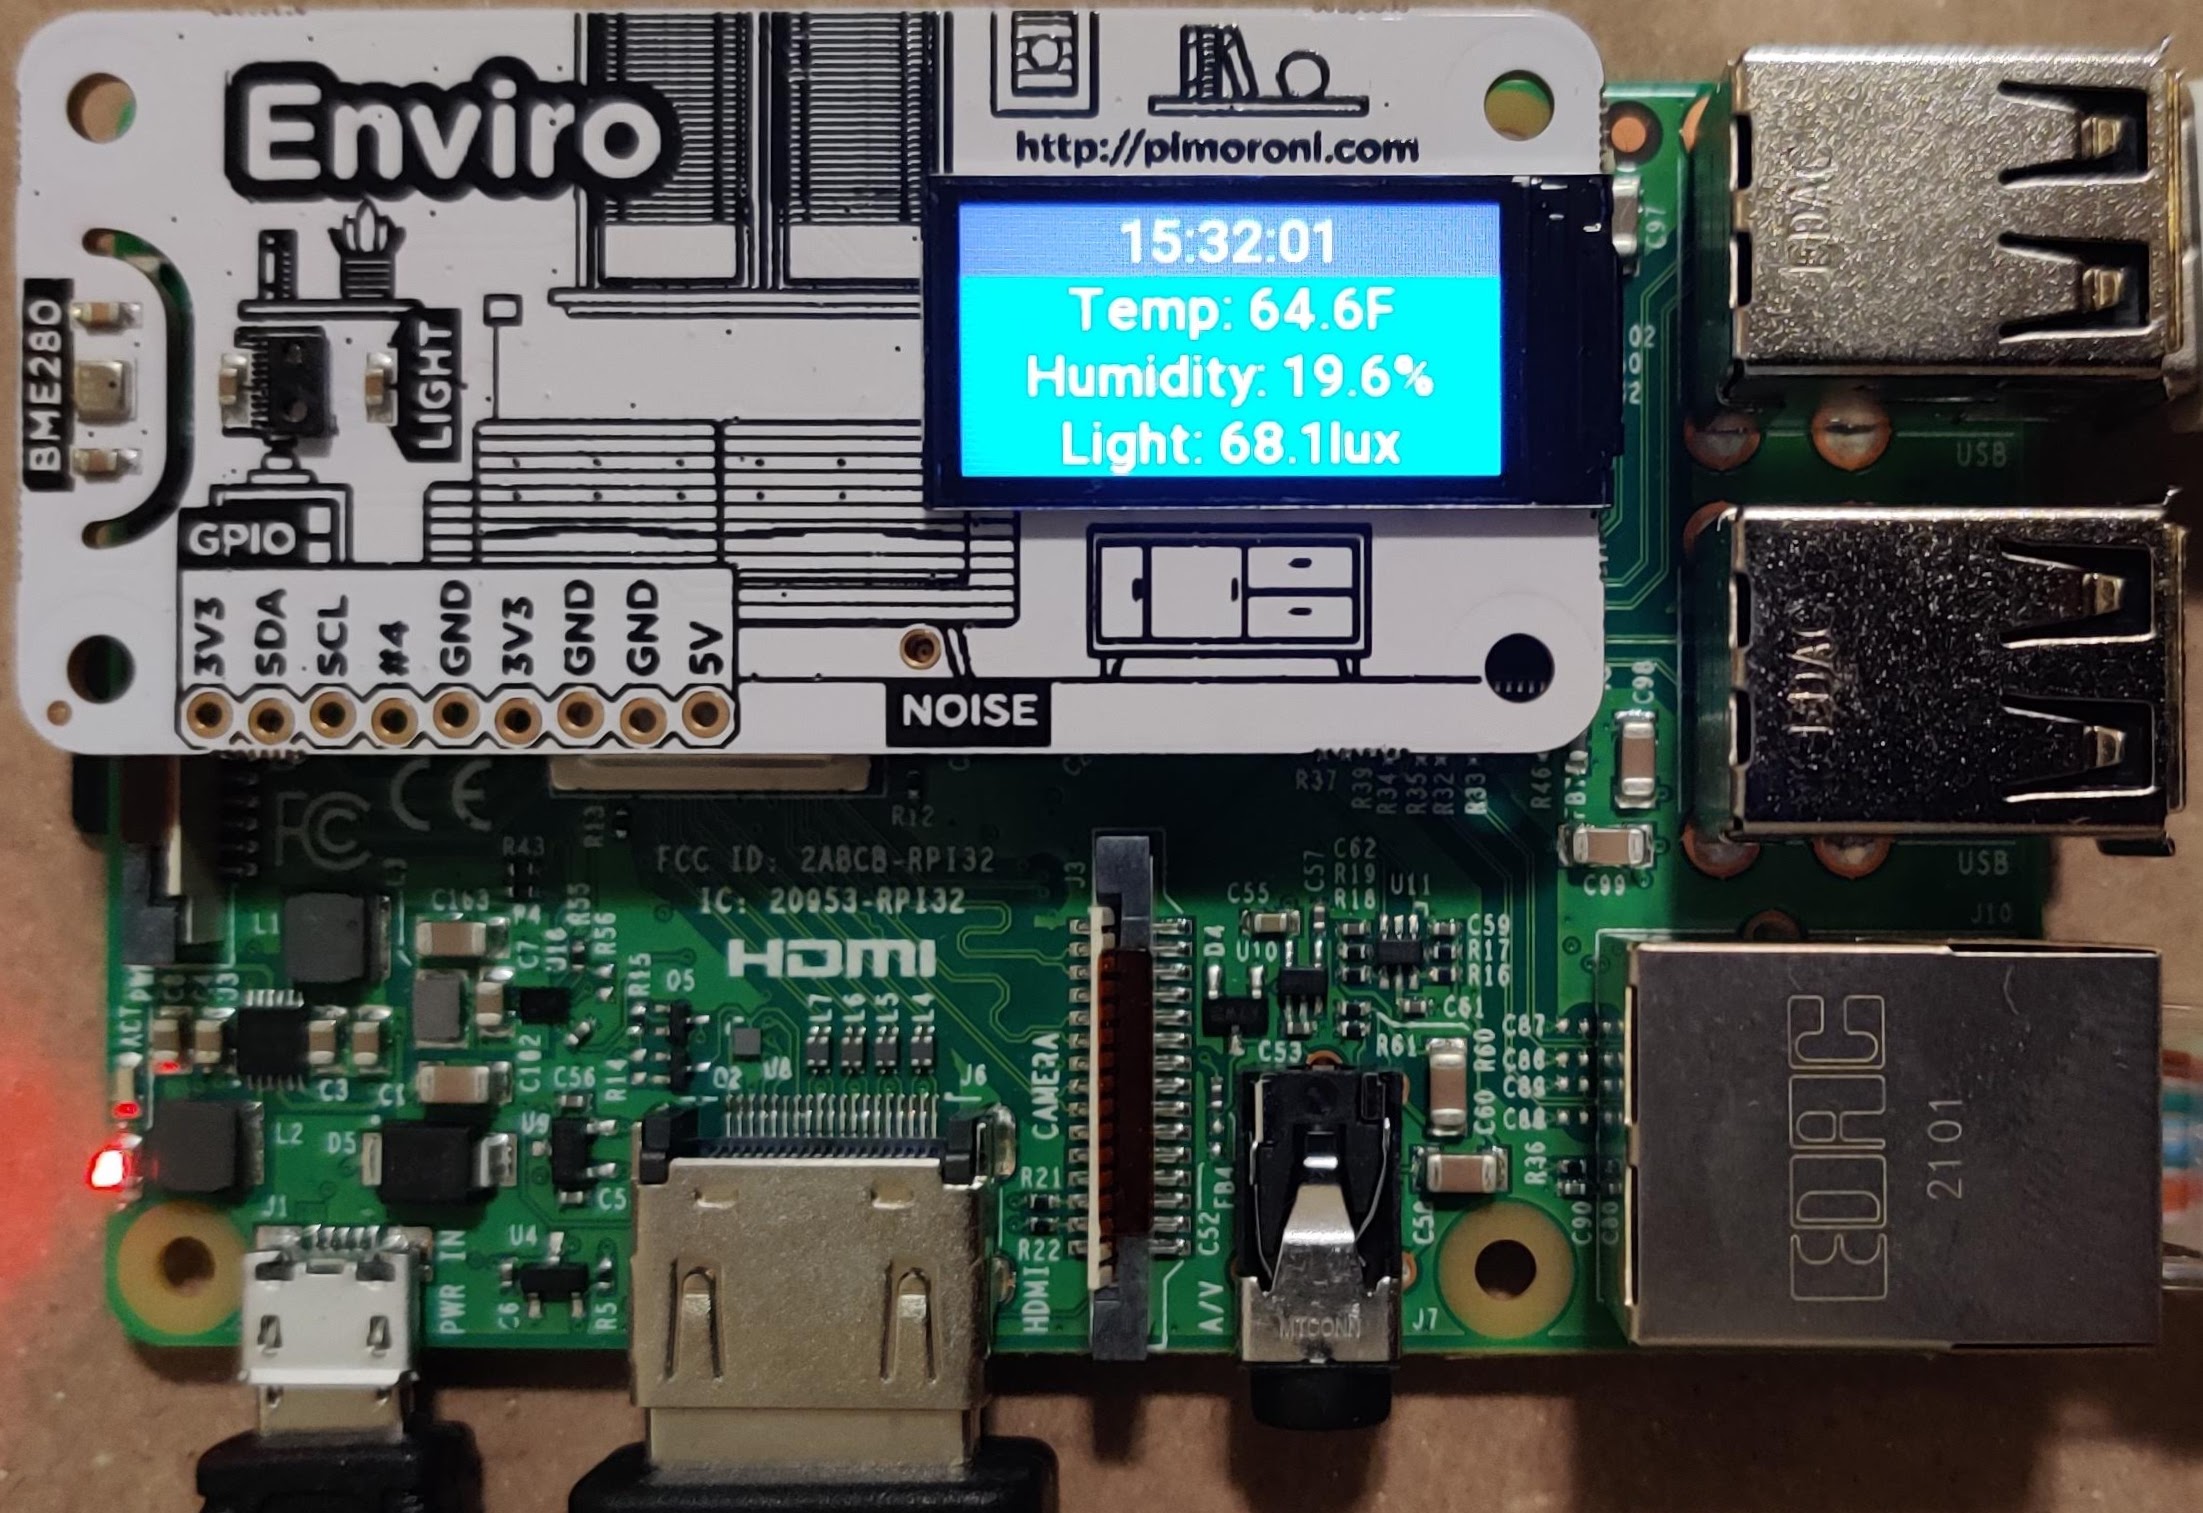
You neither need to be an electronics whiz and nor will you need a soldering iron and block off an afternoon to “build” this sensor. The only assembling required is to connect the environment sensor “enviro” to the Raspberry Pi on its 40-pin connector. But let’s start with the require hardware (more details and purchase links are in section 6 below)
Raspberry Pi 3 or 4 (ideally with an ethernet port, Pi Zero with external USB ethernet adapters works too)
Once you have all the hardware together, simply connect the enviro sensor to the Raspberry Pi by gently pushing it onto the Raspberry Pi and connect the power adapter. The emphasis is on gently since the connector can sometimes be a tight fit and being impatient can damage the connector on the Raspberry Pi or the sensor. Once you’ve joined the two things together it’s time to address the software side of things and prepare the microSD card, for which you have 2 options:
1a. Use our pre-built image and simply change the IP address and password (fastest and easiest) 1b. Install a standard Raspbian OS and configure the sensor, scripts and SNMP daemon manually
1a. Using the Pre-Built Image
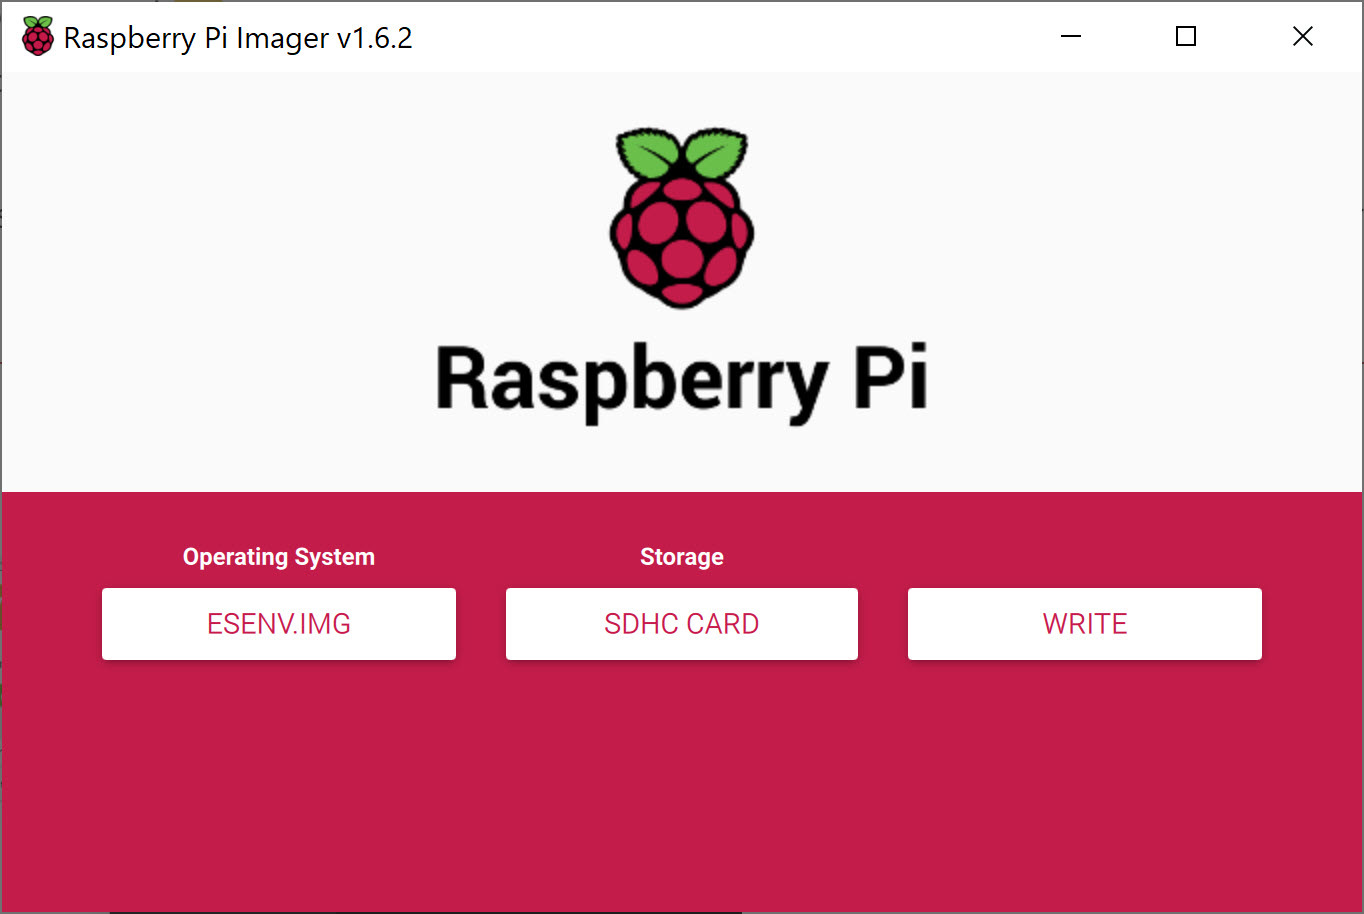
First, download the image file and decompress it. While that’s downloading, download the Raspberry Pi Imager for your OS and insert the microSD card into your computer or adapter. Launch the imager once the image has been downloaded. In the imager, click CHOOSE OS and select Use custom. Then click on CHOOSE STORAGE and select the microSD card you’ll be using and click WRITE.
When complete, insert the microSD card into the Raspberry Pi, connect it to your LAN and power it up. The pre-built image is ready to go, and the only configuration necessary is setting a static IP address. You can do this either via SSH if you can determine its IP address (either through DHCP logs or ARP activity – if you have EventSentry installed then it can help with both) or with keyboard and monitor via HDMI. The default username and password for our image are:
Username: pi
Password: BlackRaspbe11y&
Hostname: eventsentry-enviro
Once you’re connected and logged in, it’s recommended to update all software packages of the Raspberry Pi to the latest version with the following commands:
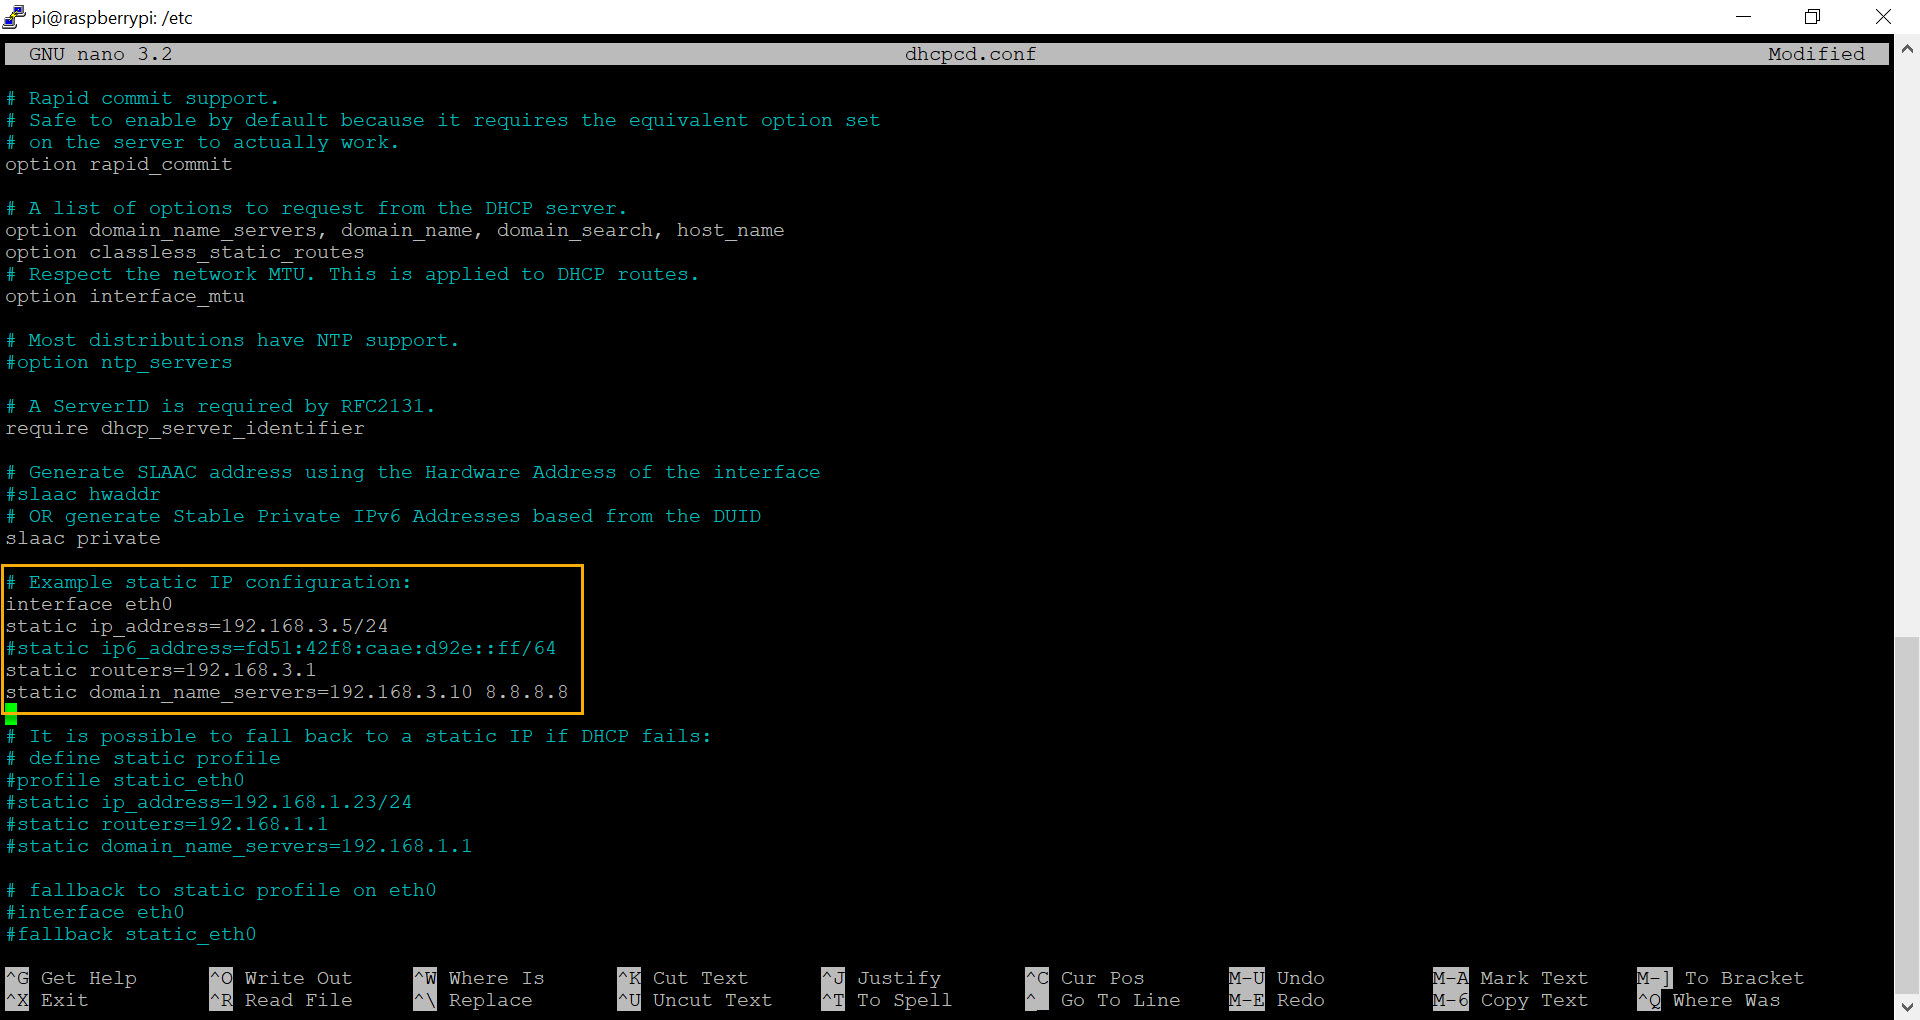
While not always necessary, reboot the Raspberry Pi after the last step and log in again. Then, issue the following command to open the network configuration file and set a static IP address:
sudo nano /etc/dhcpcd.conf
The nano text editor works like any Windows-based editor where you can navigate with the arrow keys. The configuration file already contains sample entries for a static IP address as shown in the screenshot below.
As such, simply scroll down to this section and replace the same IP addresses with the actual IP addresses of your router, DNS server and of course the desired IP address for your networked sensor. Don’t forget to uncomment the new configuration by removing the heading # characters. An example configuration is also shown below:
Once the configuration looks ok, hit CTRL+O followed by CTRL+X. The final step is to resize the root partition so that it utilizes the entire space available on the SD card (assuming the SD card is larger than 4Gb). This step is optional but recommended since it’s both easy and fast. From the terminal, run
sudo raspi-config
and select the following:
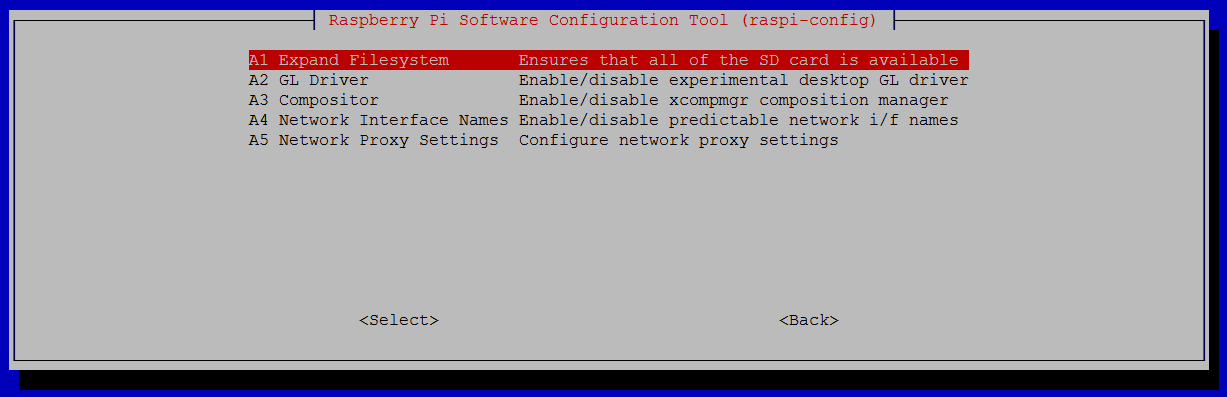
6 Advanced OptionsA1 Expand Filesystem
Note that there is no confirmation after selecting “Expand Filesystem”, instead you will be prompted to reboot the raspberry pi since the file system will be resized during the next boot. If you chose not to reconfigure the file system then reboot the device by running sudo reboot.
1b. Manual Setup with Raspbian
Insert the microSD card into your computer or adapter, download the Raspberry Pi Imager for your preferred OS and launch it. In the imager, click CHOOSE OS and select the first option, Raspberry Pi OS (32-bit). Then click on CHOOSE STORAGE and select the microSD card you’ll be using and click WRITE.
When complete, insert the microSD card into the Raspberry Pi, connect it to your LAN, connect a monitor & keyboard and power it up. After it booted, follow the setup process which will let you pick a language and ensure that your Pi is up to date.
In the OS settings, enable SSH access if you want to manage the pi remotely later.
Installing the enviro library
Open the terminal window and execute the following commands. I recommend installing the examples too when prompted. This basically enables support for the sensor in the OS and installs example Python scripts. If you do not change directories, then the files will be installed in /home/pi/enviroplus-python.
The EventSentry git repository contains two scripts and a MIB file to integrate the enviro sensor with the local SNMP daemon. The Python script (eventsentry_enviro.py) runs in the background, constantly polling the sensor, and writes the current readings to temp files. The Perl script (eventsentry_enviro_snmp_pass.pl) is called by the SNMP daemon whenever a specific OID is called and provides the temperature, humidity and light readings via SNMP.
Execute the following command, which will place all files in /home/pi/sensors/raspberry_enviro:
git clone https://github.com/eventsentry/sensors
Activate background polling script
The eventsentry_enviro.py script needs to be launched at startup and run in the background (via cron) in order to continuously poll the sensor and save current values to temp files. Run crontab -e and add the following line to the configuration:
With snmpd installed and the scripts downloaded, they can be integrated by editing the /etc/snmp/snmpd.conf file with
sudo nano /etc/snmp/snmpd.conf
The following lines need to be added to the snmpd.conf file. I would recommend adding them to the sections were similar entries already exist to make it easier to manage in the future:
view   systemonly  included   .1.3.6.1.4.1.21600
pass .1.3.6.1.4.1.21600.1.5.1.1.1 /usr/bin/perl /home/pi/sensors/raspberry_enviro/eventsentry_enviro_snmp_pass.pl
Just like before, save your changes in nano with CTRL+O followed by CTRL+X. If you prefer to change the default SNMP community (from the default “public”) then that can be done in the snmpd.conf file as well. When done, restart snmpd with the command below. This is technically optional since we’ll be restarting the Pi anyways, but not a bad idea to make sure there are no configuration errors in the snmpd.conf file.
sudo service snmpd restart
Finalize
To launch the all important eventsentry_enviro.py script and make sure your Raspberry Pi is self-sufficient even after a power failure reboot the pi again with
sudo reboot
2. Polling & Testing via SNMP
At this point you should be able to query the current temperature, humidity and light level with any SNMP manager, such as EventSentry. The EventSentry MIB has been updated to support the enviro sensor, and all values are returned as part of a table, making it easy to add additional readings without having to change the configuration on the SNMP manager (at least with EventSentry). The key connection details are as follows:
SNMP Version: 1, 2c
SNMP Community: public
One way to obtain the current values is with snmpwalk that is available with pretty much every Unix/Linux distribution and also installed on your Raspberry Pi.From the command line issue the following snmpwalk command (adjust the community if you changed it):
snmpwalk -v 2c -c public 127.0.0.1 1.3.6.1.4.1.21600.1.5.1.1.1
which should yield output similar to what’s shown below:
Where the temperature is 63 degrees F, the humidity is 18% and the current light level is 1 Lux.
3. Integrating with EventSentry
Integrating the sensor is straightforward and done in the management console. You can either add a single object in EventSentry that receives the values for all instances (temperature, humidity & light), or setup individual counters for each reading. The latter option requires additional configuration but allows you to setup individual alerts, something that is not possible with the first option.
3a. Adding all SNMP counters in a single object (table support)
If you want to skip steps 1-5 below then you can download a pre-made package from the management console. Simply click on “Packages”, click “Download” in the ribbon, proceed with the download and then select the “RaspberryPi Enviro” package from the “System Health Packages” section and import it. If, on the other hand, you want to practice your performance monitoring skills in EventSentry then follow steps 1-5 below:
Open the management console
Add the raspberry pi to an existing group under “Computer Groups”, or create a new group and add it there.
Select the host you just added and click the “Authentication” button in the ribbon to specify the SNMP credentials.
Under “Packages” – “System Health”, create a new package or find an existing one. Add the “Performance” object to that package if it doesn’t already exist.
Click the “Performance” object and add a performance counter as shown in the screenshot below.
Alerts are configured on the “Alerts” tab but would affect all counters. This could be tricky, since you would not be able to set an alert for humidity > 60 and an alert for temperature > 80. Still, in this scenario you could actually setup an alert for a value > 80 that would likely be useful for both temperature and humidity, since you would probably not want either of those to be over 80. At a minimum, click the History & Trending tab to store collected values in a database. To verify that the raspberry pi is reachable via SNMP, click the Test button and enter the host name you added to the group earlier.
Showing temperature readings from 2 Piemoroni enviro sensors side-by-side in EventSentry
See the next section on how to setup individual counters for temperature, humidity and light.
3b. Setting up individual counters for temperature, humidity and light
The configuration for individual objects is very similar to the previous approach. Table support will not be used however, and each counter will have its index value appended to the original OID used in 3a.
Add the raspberry pi to an existing group under “Computer Groups”, or create a new group and add it there.
Select the host you just added and click the “Authentication” button in the ribbon to specify the SNMP credentials.
Under “Packages” – “System Health”, create a new package or find an existing one. Add the “Performance” object to that package if it doesn’t already exist.
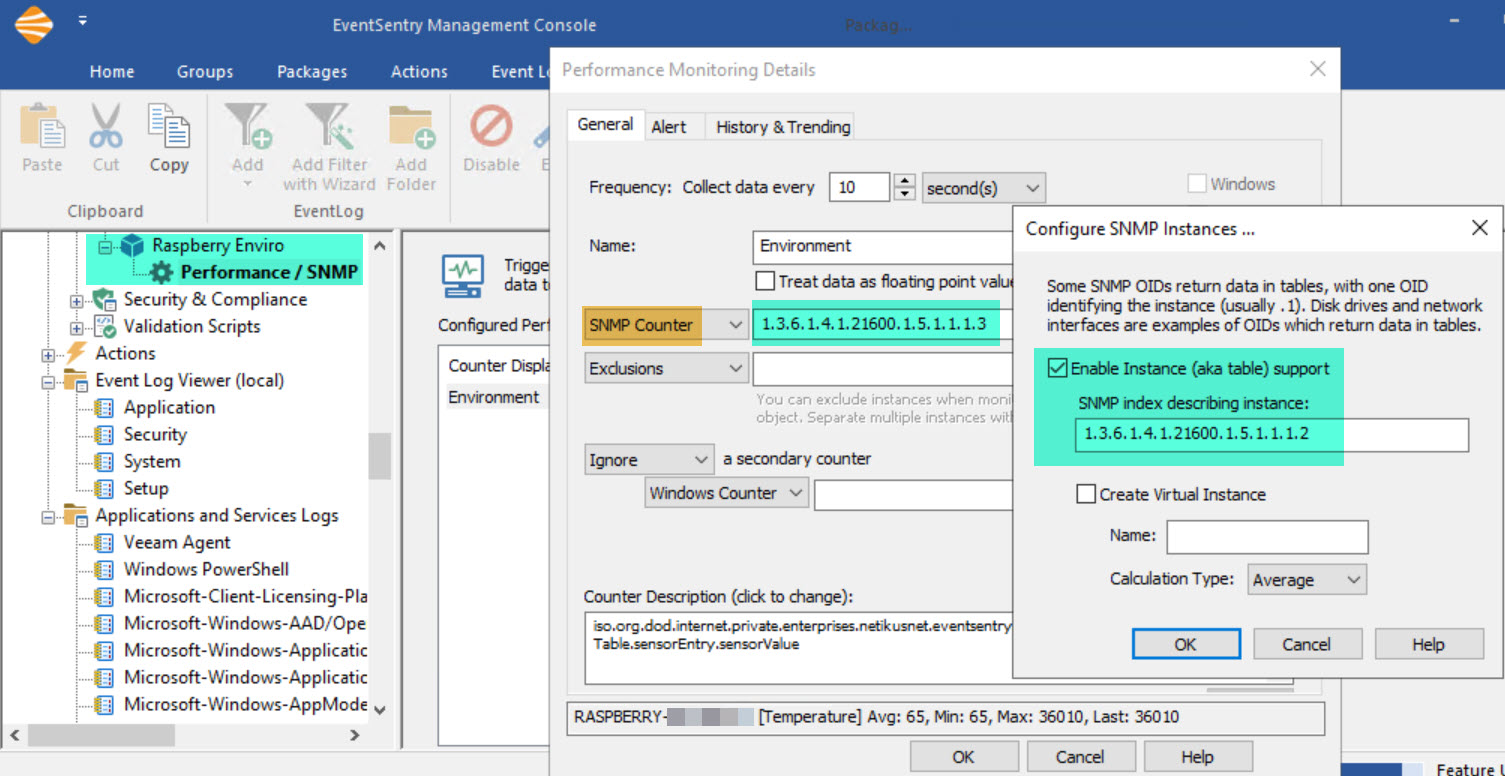
Click the “Performance” object and add three performance counters as shown in the screenshot below.
Temperature Counter
Then, simply duplicate the above setting for humdity and, if required, for the light sensor as well. You just have to change the Name and the SNMP counter as shown above. Since every measurement now has its own counter, it is possible to setup individual alerts.
To verify that the raspberry pi is reachable via SNMP, click the Test button and enter the host name you added to the group earlier.
4. Accuracy
The enviro sensor uses the BME 280 by Bosch to measure temperature, humidity and pressure. You can review the datasheet of the BME 280 sensor for more information on accuracy, operating ranges and such. The overall accuracy for the temperature sensor is about +/- 3 degrees Fahrenheit, the humidity sensor has a similar accuracy of about +/- 3%.
Since the sensor board sits directly on top of the Raspberry Pi, Pimoroni explains that the temperature of the Raspberry Pi board (the CPU in particular) can affect the temperature readings, causing them to be higher than the actual surrounding temperature. I suspect that different Pi models (Pi v3, v4, PiZero, …) will affect the temperature differently. They do include a Python script that automatically corrects that, and our script does as well. Still, I would probably not use this sensor for scientific measurements that require a high accuracy. However, for normal usage where you are mainly trying to determine whether a specific location is dangerously hot (or humid), the sensor’s accuracy should be more than sufficient.
5. Visual Alerts
By default, the sensor will show the temperature or humidity in red under the following circumstances:
1. The temperature is higher than 80F 2. The humidity is lower than 10%
These thresholds are hard-coded in the eventsentry_enviro.py script and can easily be changed. Simply open the script in an editor and adjust these lines on the top of the script:
thresholdTemp = 80
thresholdHumidity = 10
Restart the Pi so that the new values become effective.
6. Hardware
Here are some links to the required hardware for this project in one place. Again, keep in mind that at the time of writing the Raspberry Pi 4 (and 3) are somewhat hard to get so you may need to try different sites or even pre-order.
When purchasing the standard Pi case it’s recommended to leave the top off, so that the sensor readings are more accurate. We are currently working on creating a custom case that will only cover part of the case in order to ensure the sensors are not blocked – stay tuned!
7. Troubleshooting
Sometimes thing just don’t work like the should no matter how hard you try. Here are the most common things to check if you are unable to retrieve the environment measurements via SNMP:
Enviro Sensor
Since everything ultimately depends on the actual hardware sensor working, the first troubleshooting step would be to make sure that the sensor is working. You can of course skip this step if the sensor LCD display is showing environment readings.
If you are getting error messages then see ” Installing the enviro library” earlier and rever to the enviro web page for more information.
Automatic Sensor Polling
It’s important that the EventSentry enviro polling script is launched automatically at boot, see section “Activate background polling script” earlier. You can run the following command to verify that the script is indeed running. You should see lines.
If you’re getting environment measurements and the SNMP daemon is running then it’s time to dig deeper and see if the SNMP is responding to GET requests. Run the following snmpwalk command, the output should look similar to what’s shown below. Again, replace “public” with your actual SNMP community if you changed it.
pi@eventsentry-enviro:~ $ snmpwalk -v 2c -c public 127.0.0.1 1.3.6.1.4.1.21600.1.5.1.1.1
iso.3.6.1.4.1.21600.1.5.1.1.1.1.1 = INTEGER: 1
iso.3.6.1.4.1.21600.1.5.1.1.1.1.2 = INTEGER: 2
iso.3.6.1.4.1.21600.1.5.1.1.1.1.3 = INTEGER: 3
iso.3.6.1.4.1.21600.1.5.1.1.1.2.1 = STRING: "Temperature"
iso.3.6.1.4.1.21600.1.5.1.1.1.2.2 = STRING: "Humidity"
iso.3.6.1.4.1.21600.1.5.1.1.1.2.3 = STRING: "Light"
iso.3.6.1.4.1.21600.1.5.1.1.1.3.1 = INTEGER: 64
iso.3.6.1.4.1.21600.1.5.1.1.1.3.2 = INTEGER: 18
iso.3.6.1.4.1.21600.1.5.1.1.1.3.3 = INTEGER: 0
iso.3.6.1.4.1.21600.1.5.1.1.1.3.3 = No more variables left in this MIB View (It is past the end of the MIB tree)
SNMP works remotely
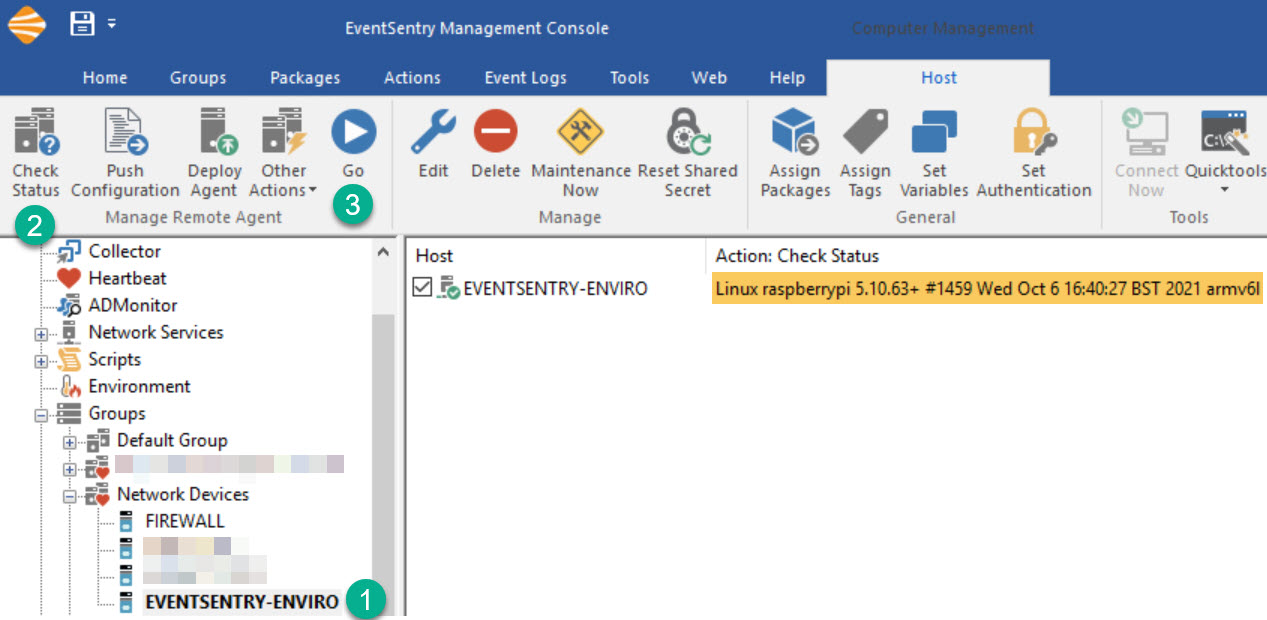
Since the Raspberry Pi does not have a firewall activated by default it’s unlikely that SNMP will work locally but not remotely. In any case, you can either run snmpwalk from a remote machine that has it installed, or use EventSentry to verify that the Raspberry Pi is accessible via SNMP.
Open the management console, selec the host entry for the Raspberry Pi, click “Check Status” followed by “Go” and review the results.