Auditing DNS Server Changes on Windows 2008/2008R2/2012 with EventSentry

In part one of this blog series we showed how to monitor DNS audit logs in Windows 2012 R2 and higher with EventSentry.

Before I continue I need to point out that DNS auditing has become significantly easier starting with Windows 2012 R2. Not only is it enabled by default, but the generated audit data is also much more granular and easier to interpret. The logged events even distinguish between regular and dynamic updates, making it easy to filter out noise. So if you’re serious about DNS auditing and have the option to update then I recommend you do so.

If you’re running Windows 2008 (R2) or 2012 then setting up DNS auditing requires a few steps. Thankfully it’s a one-time process and shouldn’t take more than a few minutes. On the EventSentry side a pre-built package with all the necessary rules is available for download and included with the latest installer.

Please follow the steps outlined below exactly as described, auditing won’t work or will be incomplete if these steps aren’t followed exactly as described below.

Enabling Directory Service Auditing

Enabling Sub Category Auditing

We first need to make sure that the new subcategory-based audit settings are enabled in group policy. If you’ve already done that, then you can skip this step and jump to “ADSIEdit”.

Since most of the steps here involve domain controllers, I recommend that you make the changes in a group policy, e.g. in the “Default Domain Controller” policy. In Group Policy Management, find an existing group policy, or create a new one, and set Computer Configuration\Polices\Windows Settings\Security Settings\Local Polices\Security Options\Force audit policy subcategory settings (Windows Vista or later) to override audit policy category settings to Enabled.

Then, navigate to Computer Configuration\Polices\Windows Settings\Advanced Audit Policy Configuration\Audit Policies\DS Access and set Audit Directory Service Changes to Success.

ADSI Edit

Open ADSI Edit via Start -> Run -> “adsiedit.msc”. If your default naming context does not automatically appear OR if the listed naming context does not include dc=domaindnszones, then select “Action -> Connect To” and connect to the appropriate naming context, e.g.

dc=domaindnszones,dc=yourdomain,dc=com

Replace the dc components after “domaindnszones” with the actual DNS name of your domain. It’s important that “dc=domaindnszones” is part of the naming context.

Once connected, expand the naming context and locate the “CN=MicrosoftDNS” container, right-click it, and select Properties. Then select Security, Advanced, Auditing and click on Add. In the resulting dialog we’ll audit the built-in “Everyone” user so that DNS changes from everyone are audited:

Name (Principal): Everyone
Apply onto:       This object and all descendent objects
Access:           Create dnsZone objects


Enabling auditing with ADSI Edit (1)

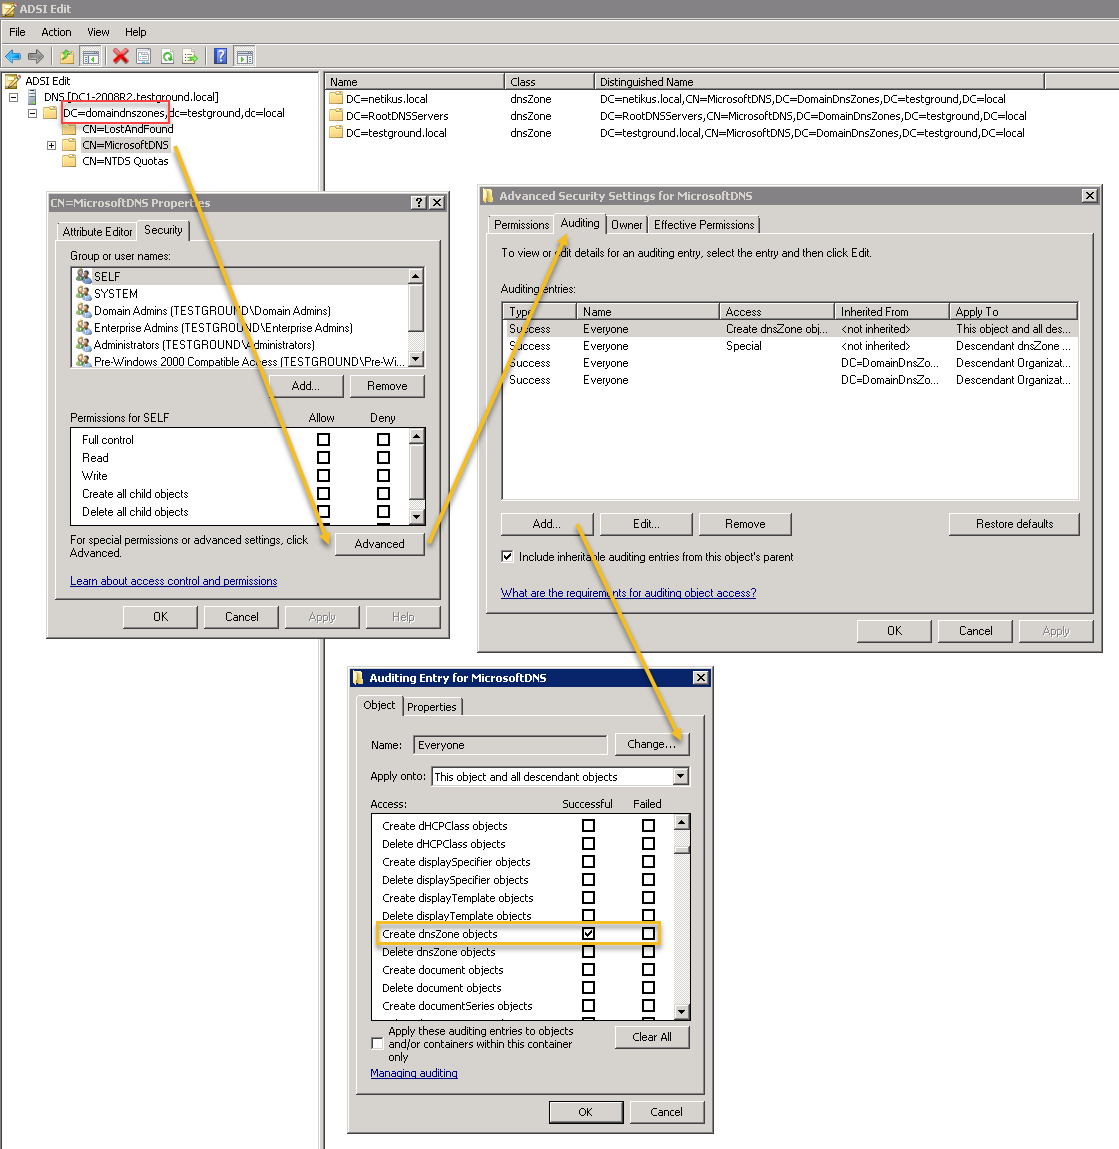
It may seem tempting to also check the “Delete dnsZone objects”, but resist the temptation. Don’t be fooled by the term “dnsZone”, the ACE entry we just added will audit the creation of all AD DNS objects (and not just DNS zones) and log event 5136 to the security event log. In order to audit deletions as well, click “Add” again but this time configure the dialog as shown below:

Name (Principal): Everyone
Apply onto:       Descendent dnsZone objects
Access:           Delete
Enabling auditing with ADSI Edit (2)

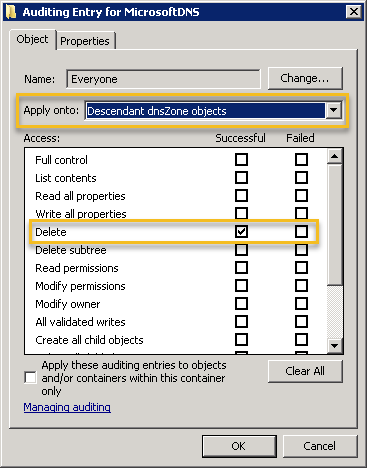
It’s important that the “Apply onto” is changed to Descendent dnsZone objects. This ACE entry will result in event 5141 being logged when a DNS-related directory service object is deleted. This is were things get a bit interesting though, since DNS records deleted from the DNS manager aren’t actually deleted. Instead, they are tombstoned (which is done internally by adding the dNSTombstoned attribute to the object). Only when the tombstoned object expires is it actually deleted. You can use ADSIEdit if you want to send a DNS object immediately to heaven and skip the graveyard stage.

Unlike Windows 2012 R2 and later, earlier versions of Windows are a little more verbose than you probably like when it comes to directory service auditing. For example, creating a new DNS A record in a zone will result in 4 different events with id 5136 being logged – and not just one. The events logged when adding or deleting a zone or A record are shown in the diagram below:

Directory Service Changes events

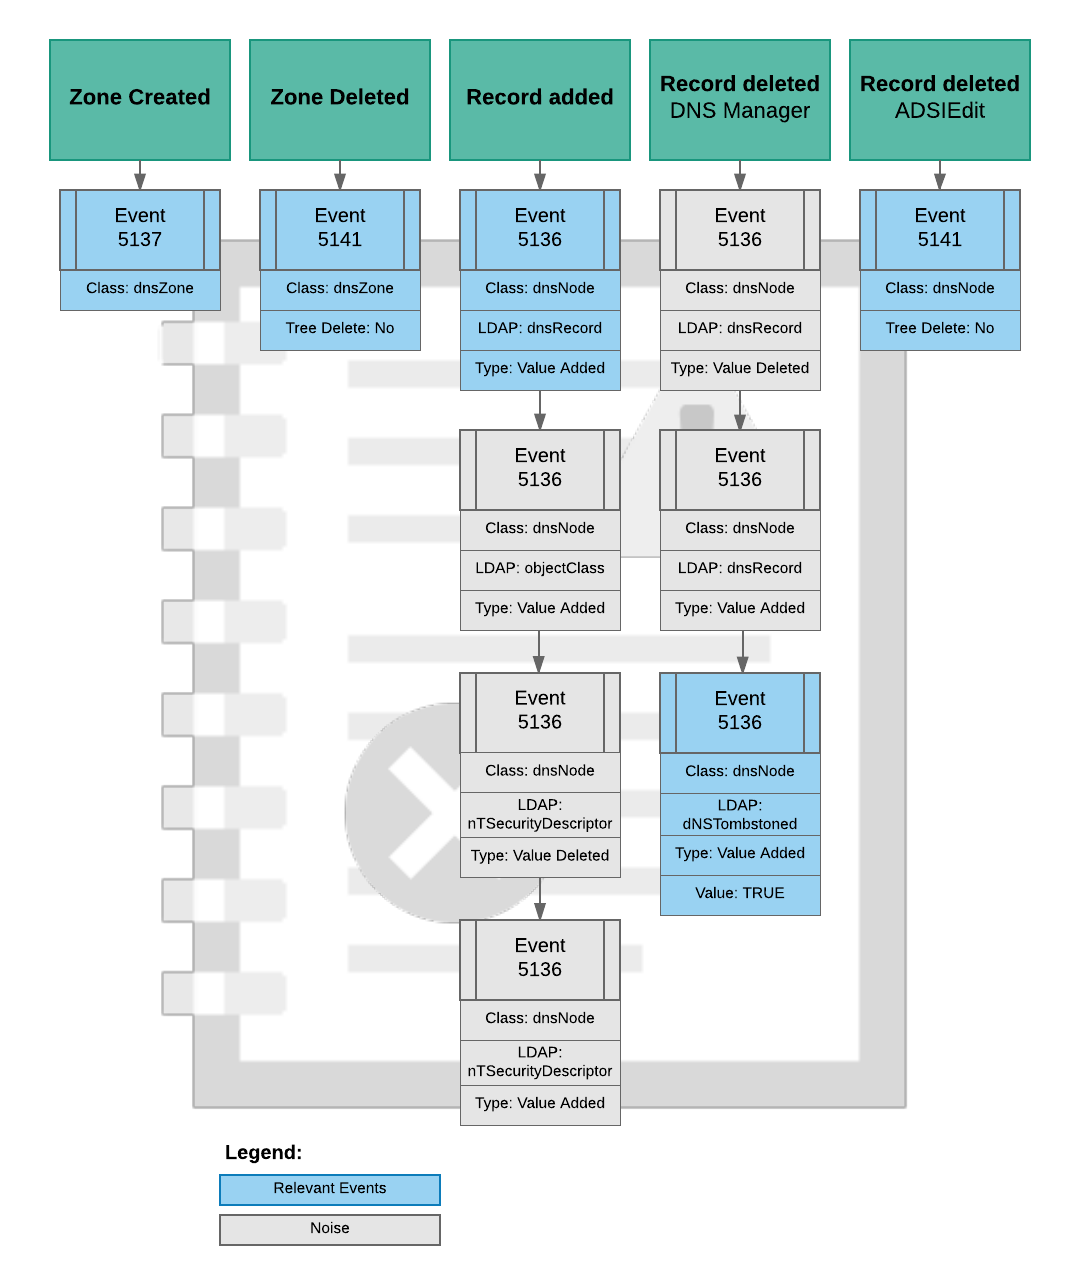
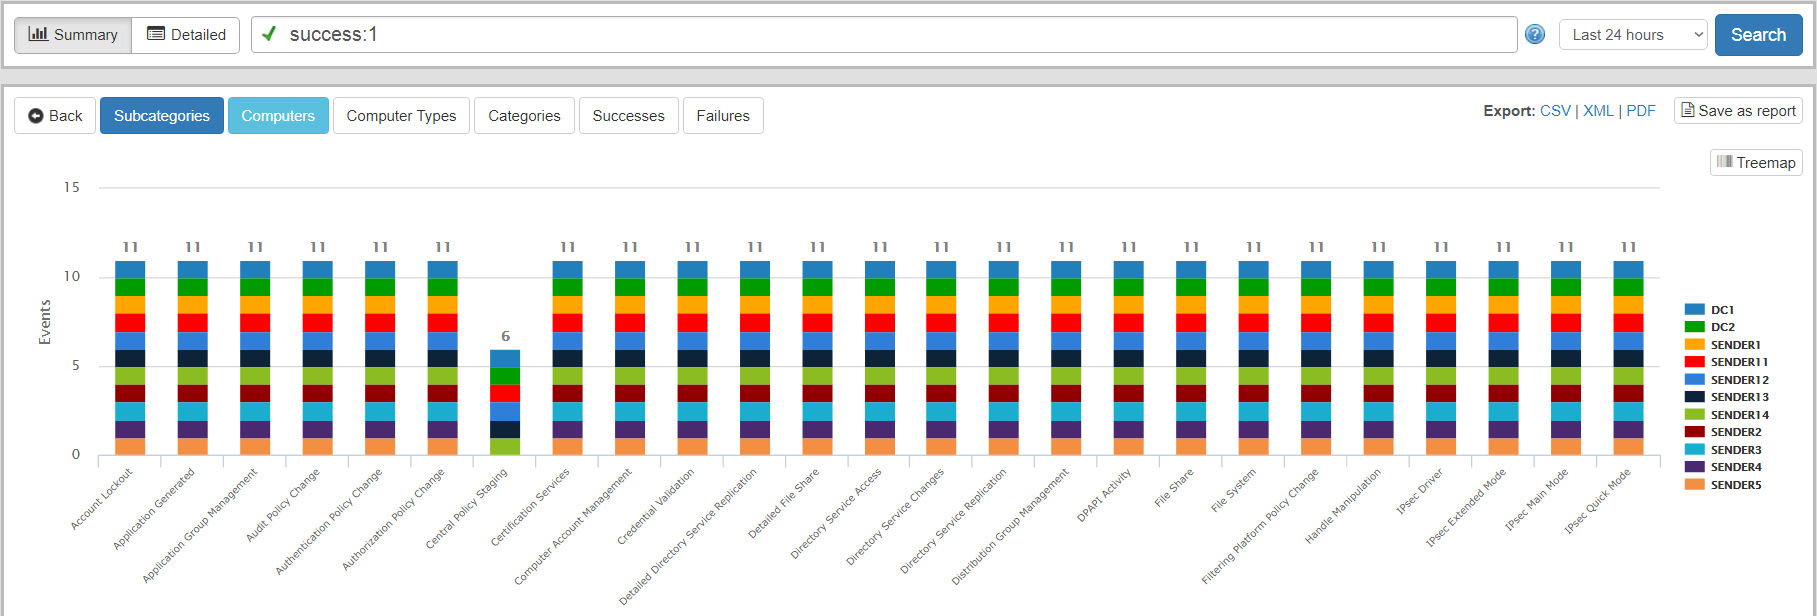
All events are logged under the “Directory Service Changes” category.

Testing

Before we start configuring EventSentry, we’ll want to make sure that auditing was setup correctly. On a domain controller, open the “DNS” application and either temporarily add a new A record or primary zone. You should either see a 5136 or 5137 events with the category “Directory Service Changes” logged to the security event log.

If you don’t see the events then walk through the above steps again, or reference this Microsoft article.

Configuring EventSentry

There are generally two things one will want to do with these audit events – store them in a database, email them or both. If you’re already consolidating Audit Success events in an EventSentry database then you shouldn’t have to do anything, all directory service change events will be written to the database automagically.

Database

If you only want to store directory service change events in the database (opposed to storing all audit success events), then you can simply create an include filter with the following properties:

Log:      Security
Severity: Audit Success
Source:   Microsoft-Windows-Security-Auditing
Category: Directory Service Changes

… and assign your database action to it.

Alerts

Setting up alerts using filters for when zones or records are added or removed is a little more involved than one would hope, thanks to Windows logging more than one event whenever such a change is done – as is depicted in the image above. For example, creating a new DNS record will result in 4 x 5136 events being logged, deleting will result in 3 events.

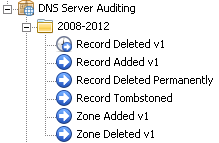
Lucky for you, we’ve analyzed the events and created a DNS Server Auditing package in EventSentry which will email you a single alert (=event) whenever a record or zone are added or removed. This package is included with all new installation of EventSentry, existing users running 3.4 or later can get it through the package update feature in the management console.

DNS Server Auditing Package

And that’s really all there is to it … if you have EventSentry installed then setting up auditing in Windows is really the only obstacle to auditing your DNS records!

EventSentry v3.4: New Security Features, Software Version Checker, Better Performance & more!

We’re again excited to announce the availability of EventSentry v3.4, the latest release of our hybrid SIEM monitoring suite.

EventSentry v3.4 delivers a number of new features to

  • Protect yourself against ransomware attacks
  • Detect lateral movement on a network with collector thresholds
  • Identify outdated software on your network
  • View detailed bandwidth utilization (requires NetFlow)
  • Monitor attached UPS devices
  • Integrate with open source solutions (Graylog, ELK, Nagios Log Server & others)

and more. We’ve also been focusing on making the data EventSentry collects more actionable and subsequently more helpful, and as result you will see additional contextual data provided with some alerts & reports, and one new search page in EventSentry.

All in all, this upcoming release has a lot of improvements in store to help you do your job better by ensuring that your network is as reliable, secure and fast as possible.

Audit Subcategories with audit success enabled, grouped by host

Ransomware

While high-profile Ransomware attacks have slowed down somewhat in recent weeks, businesses – especially small businesses – are still hit with Ransomware infections every day. Even though EventSentry is not positioned as a AV or a AntiMalware software, it does include a variety of functionality which can detect Ransomware outbreaks.

What sets EventSentry apart from AV and most AntiMalware solutions is that it looks for pattern exhibited by the Ransomware – regardless of the variant. What’s new in version v3.4 is the ability to detect changes to the MBR and bootsector as well as the ability to calculate the entropy of (changed) files.

MBR/BootSector Monitoring & Backup
Some more recent Ransomware variants modify the MBR and/or boot sector and trigger a reboot to initiate an offline encryption process. EventSentry v3.4 can now monitor the MBR and detect changes in near real-time to alert the admin when suspicious activity is occurring.

By utilizing EventSentry’s advanced filtering engine it is also possible to potentially stop the encryption process, e.g. by hibernating the infected host. EventSentry even backs up the MBR and boot sector, making it possible to repair an infected system (with a boot disk) without having to perform a full restore from backup.

MBR & Bootloader Backup

File Entropy
Entropy describes the randomness of a file, essentially a metric that can help detect compressed and encrypted files.

Since most Ransomware encrypts large amounts of files, EventSentry can utilize the entropy of a file, combined with event log thresholds, to make a determination that a Ransomware infection is in progress and take corrective measures.

Lateral Movement Detection with Thresholds

Lateral Network Movement
Lateral movement through a network

EventSentry has always included agent-side thresholds in order to throttle the alert volume or detect repeated events. Because these thresholds were executed on the agents, event patterns which involved more than one host could not be detected that way.

By adding a threshold component to collector – which analyzes and processes all events in real time – we can leverage this feature to new heights and detect network-wide event-based patterns – in real time!

Collector-side thresholds are configured exactly like agent-side thresholds with one the key difference – the threshold limit applies to all aggregated events sent to the collector. Collector-side thresholds also introduce the “Group By” setting that makes the lateral movement detection possible – the ability to count unique instances of an event property, and not just the total number of events.


Some of the event-based threat patterns you can detect:

  • The same user logging on to multiple hosts within a specific time frame
  • A process spreading (trickling) across multiple hosts within a specific time frame
  • A user running too many processes – either on a single or multiple hosts
  • Authentication failures of a user on too many hosts
  • Too many unique logon types used by a user account

Any event property and insertion string can be used to craft thresholds – the sky is the limit.

Software Version Checker

Earlier versions of EventSentry include a substantial hardware, software and patch inventory, making it extremely easy to find out which software packages are installed on your network, but also get alerted when software is installed or removed from a server/workstation.

In v3.4 we are taking this to the next level by providing the latest version available from the publisher for a growing list of 100+ software packages so that you can effortlessly identify outdated software on your network. You can now create reports listing any software on your network which is outdated, a dashboard tile is also available. The Web Reports refresh the version info list every 2 hours to ensure all reports are accurate.

If an application you are using on your network is not currently included then simply email us the name of the software as it is detected by EventSentry (and ideally the URL where we can obtain the current version) and we will add it to our list.

Software Version Check Report

64-bit Web Reports for Windows

The EventSentry web reports are now available as a 64-bit application, and upgrading to v3.4 will automatically upgrade the existing v3.x 32-bit web reports to 64-bit on 64-bit when installed/upgraded on a 64-bit version of Windows. The new 64-bit web reports will allow you to run larger reports that would not run due to limits with the address space associated with 32-bit applications.

UPS & Battery Monitoring

Any UPS directly attached to a server/workstations that is detected by Windows can now be monitored by EventSentry. The status of the UPS will show up on the host inventory page, and alerts will be generated when a host is on battery power and back on AC power. EventSentry can also initiate a shutdown when the remaining run-time or charge level falls below a certain limit.

UPS Alert

Batteries in laptops are also detected and listed on the host inventory page (battery capacity and current charge level), but generated alerts are informational only.

UPS Inventory & Monitoring

User Activity Tracking

While EventSentry provides its users with a wealth of information from multiple angles, it can be tedious to piece together data from multiple reports that is associated with a specific user. Data which can be linked to a user is scattered among process tracking, file access tracking, compliance logons and other pages.

User activity tracking

The new “User Activity” page, which is located in the “Dashboard” menu, solves this problem by displaying data from the following pages on a single page:

  • Logons
  • Processes
  • File Access
  • Active Directory Changes
  • Tasks
  • Events

The user activity page makes seeing all activity by a user as easy as never before!

Integration with third-party log management solutions

A few months ago, one of our users approached with the need to integrate EventSentry into an existing log management system which was already in place at the location where EventSentry was to be deployed. While reviewing the request we recognized that even though we position EventSentry as a one-stop log management solution with a compelling and robust web-based reporting component, an integration with other products can be helpful in some cases.

  • Supplement EventSentry’s built-in reporting with additional reporting
  • Integrate EventSentry with an existing log management solution located in a different business unit
  • Integrate EventSentry’s sophisticated real-time agent and deployment infrastructure with a different log management back-end

In version 3.3 and earlier, EventSentry can be integrated with 3rd party products using the HTTP, process and Syslog action. The HTTP & process action are intended to be used with ticketing systems where only a low volume of alerts are submitted while the Syslog action obviously supports submitting a high volume of events. The Syslog format was however limited to the traditional RFC 3164 format, making an integration with other log management systems difficult.

Starting with version 3.4, EventSentry now supports the following formats in the Syslog action

  1. RFC 3164 (legacy)
  2. Snare
  3. RFC 5424
  4. GELF (Graylog)
  5. Nagios Log Server
  6. Common Event Format (CEF)
  7. JSON (customizable)

If a log management server you need to integrate with is not listed above but supports the JSON format, then you can craft your own JSON packet with the JSON format, also introduced in v3.4.

Disk Space Alerts

Part of the effort to make EventSentry’s alerts more actionable is reflected in our improved disk space alerts which now list the 15 largest files and folders of the volume where disk space is low. The supplemental data will in many cases be enough to immediately identify the culprit so that corrective action can be taken immediately, without the need to run disk space analyzers on the volume.

Diskspace Alert with embedded file/folder size info

Audit Policy Status

Since the introduction of the compliance tracking components, EventSentry has been recording all audit (and many other!) changes performed in Windows as part of the “Policy Changes” feature. It wasn’t however possible to see the current status of all audit categories and subcategories at a glance. Reviewing the current audit status of all monitored hosts can be important however, if only to verify that group policies are configured correctly.

Hosts with disabled audit subcategories

In v3.4 we now have the new “Status” page available under “Compliance -> Audit Policy” which delivers information such as:

  • Compare/review audit settings of a particular sub category (e.g. “Registry”) among all monitored hosts
  • View all disabled audit settings across all or select hosts
  • (Re)view audit settings based on computer types (e.g. domain controllers, servers, workstations)

NetFlow Bandwidth

Our NetFlow component can now provide bandwidth visualization based on the collected NetFlow data. The information can either be accessed on the NetFlow page or as a dashboard tile. Even though bandwidth data can already be determined using SNMP, the data gathered by NetFlow should be preferred since it contains additional data not available via SNMP, such as:

  • Packets sent/received
  • Bytes sent/received
  • Bytes per packet
  • % Utilization

Bytes per packet as well as packets sent received can be used to detect anomalies, e.g. when a host sends a large amount of network packets, or network packets with large/small content.

NetFlow Bandwidth