The latest iteration of EventSentry adds many powerful security features, continuing to enhance EventSentry’s ability to improve the security of Windows-based networks by strengthening its foundation and detecting suspicious behavior.
Local Inventory
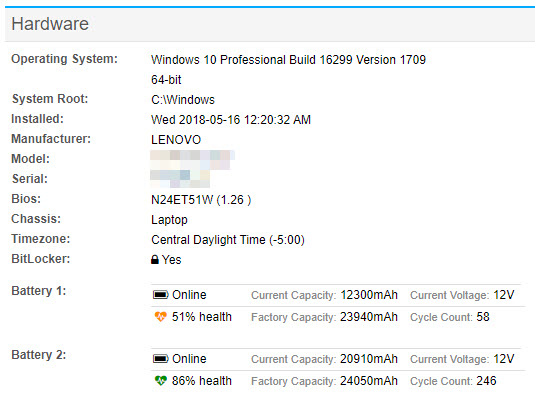
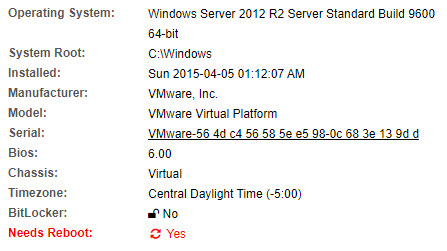
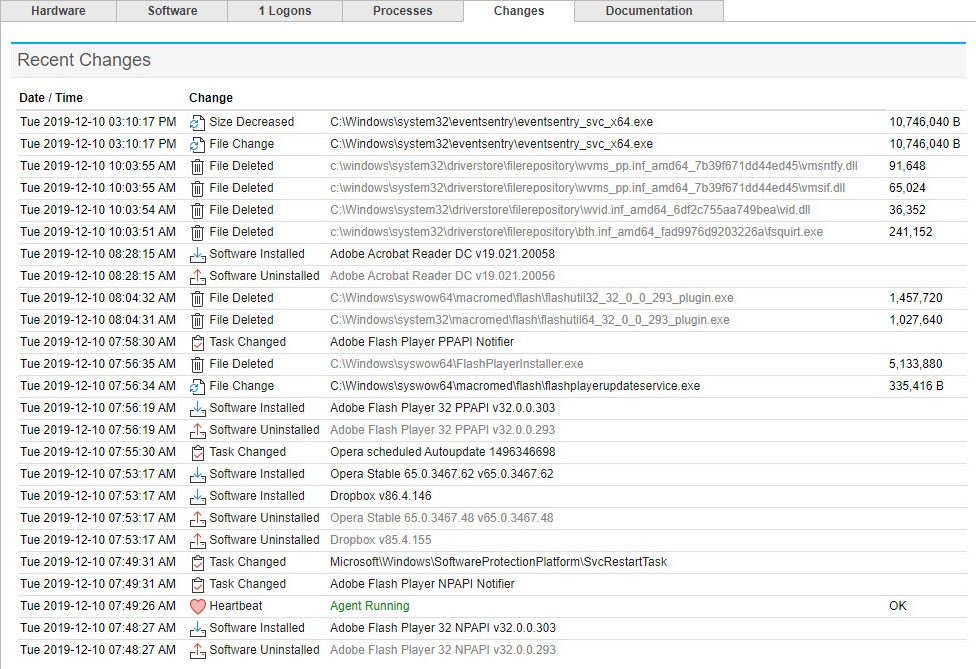
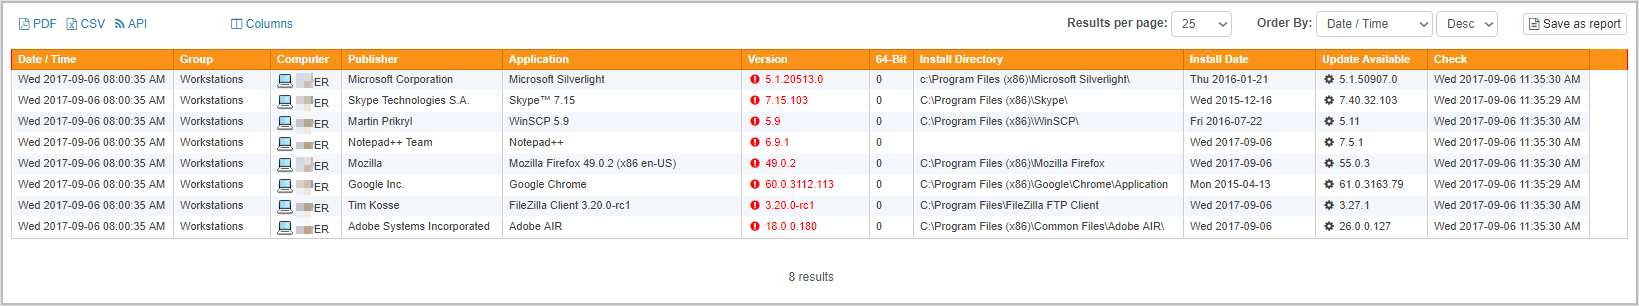
EventSentry already provides an impressive inventory of monitored end points, including software, browser extensions, hardware, services, tasks and much more. Being added to the mix are:
- Local User
- Local Groups
- (File) Shares
As such, you can now review all local users & groups that exist across your entire infrastructure, making it easy to identify administrative as well as suspicious or unneeded user accounts. Providing insight into all shared resources across the network again lets Sysadmins spot unnecessary or insecure local file shares.
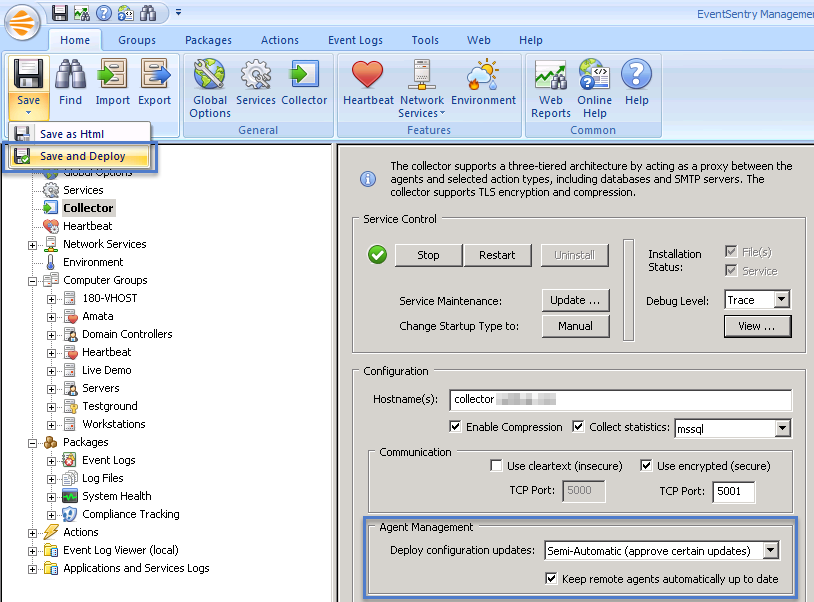
Sysmon Management
The Sysmon utility, part of the Microsoft Sysinternals Suite, is a powerful, free add-on which is already tightly integrated in EventSentry via the Process Sysmon feature, which tracks network activity by individual processes. And while Sysmon is a great utility, it does have a major flaw: Deployment (or lack thereof). Installing and maintaining Sysmon is a manual process that doesn’t scale well across larger enterprises. But EventSentry users neither need to worry about maintaining the latest version of Sysmon nor keeping the Sysmon configuration updated – the new Sysmon management features takes care of both! Simply point EventSentry to the Sysmon URL (or a local copy), specify a configuration file (of course we ship one) and move on!

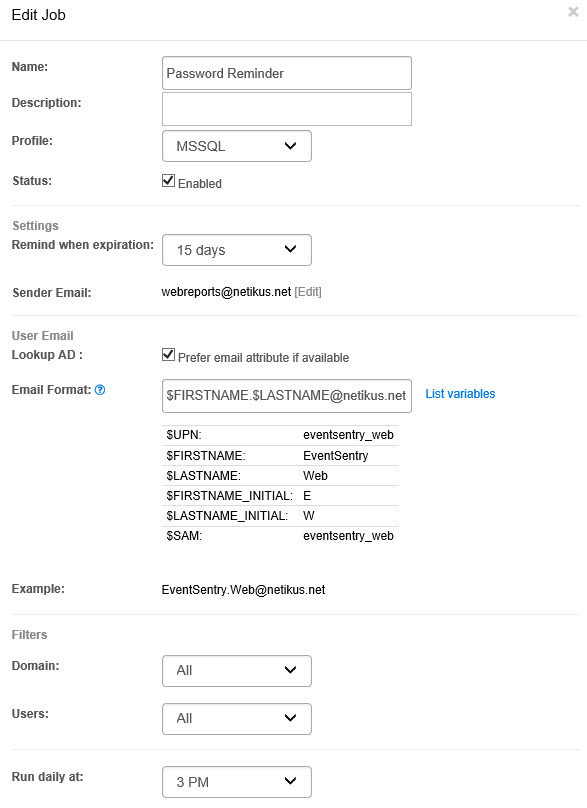
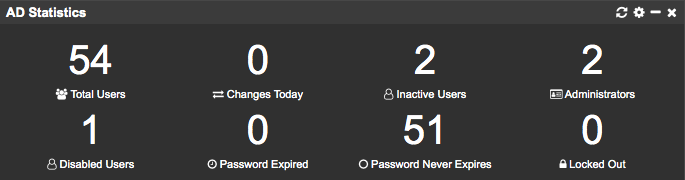
Tackle Compromised & Duplicate Active Directory Passwords
ADMonitor can now take advantage of two powerful features to strengthen the security of their Active Directory domains:
- Identify Compromised Passwords
- Identify Duplicate Passwords
ADMonitor can now query the haveibeenpwned.com web site to identify AD user accounts with a password that has been previously compromised in a data breach. A user account flagged by ADMonitor indicates that the password of this particular user has been part of a breach at some point – it doesn’t mean that this particular AD user account has been breached.
Multiple user accounts sharing the same password creates a number of security risks, but usually remains undetected. ADMonitor in v5.2 can now detect duplicate passwords, that is more than one AD user accounts using the same exact password.

Taking advantage of these new features – combined with the standard ADMonitor functionality and validation scripts – significantly strengthens the security of your Active Directory domain.
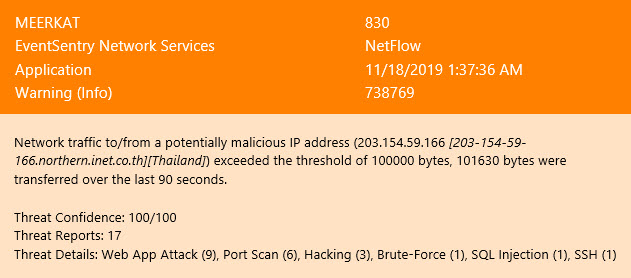
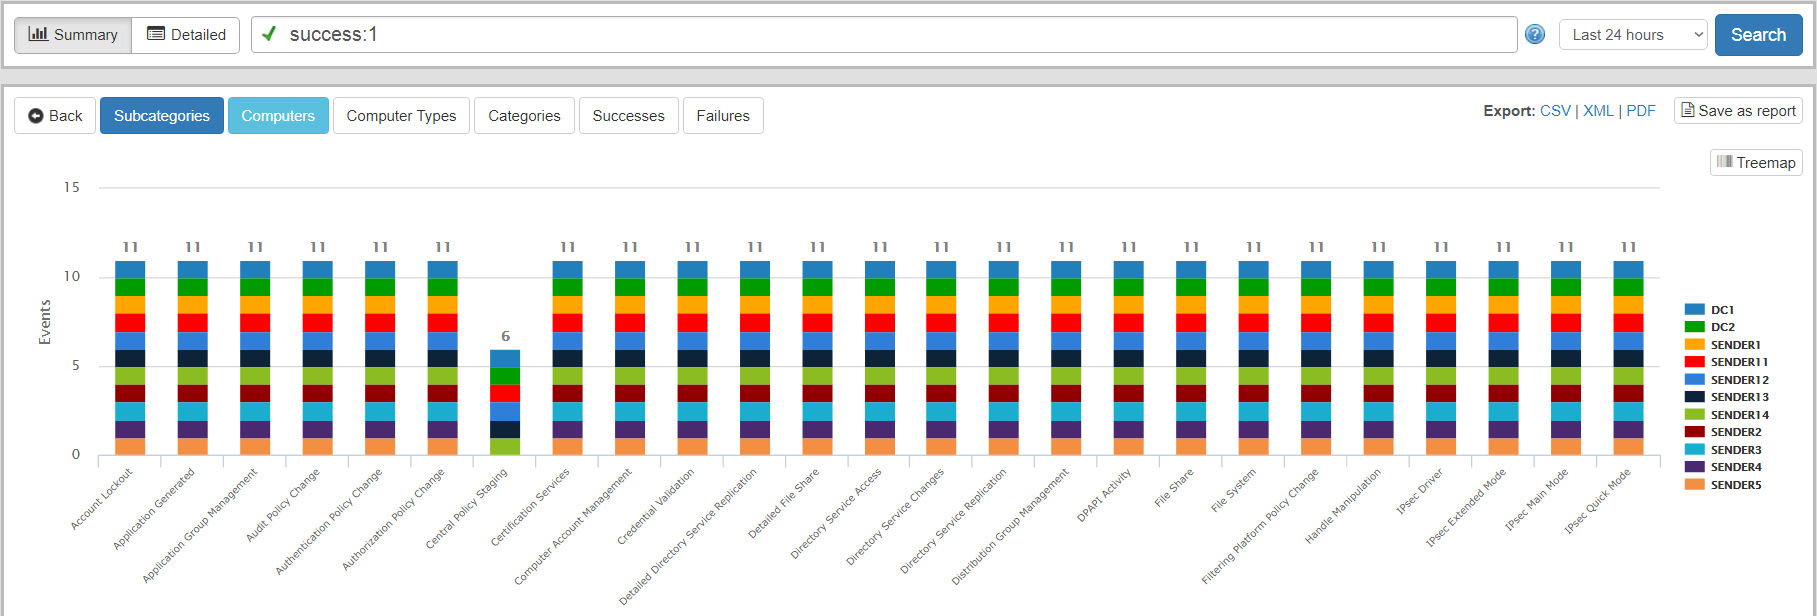
Threat Scoring
Events can now be tagged with a “threat score”, usually a number between 0 and 100. The EventSentry agent then keeps track of these threat scores, adding them up as they occur and issuing alerts if the threat score exceeds a certain threshold within a configurable time period. This is somewhat similar to the already-existing “Filter Chaining” feature, albeit more flexible since it doesn’t require creating separate packages. Filter chaining is still around however, especially since it allows specifying the order in which events occur.

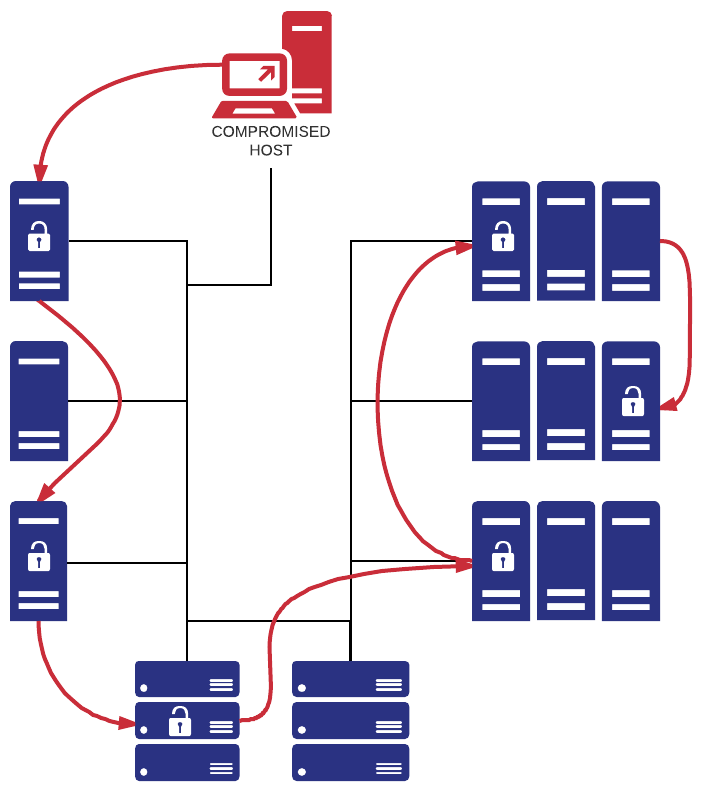
A practical example of threat scoring is the detection of admin tools that are often utilized by attackers when they gather information from a compromised host. We’re talking about apps like whoami.exe, ipconfig.exe, reg.exe, wmic.exe, systeminfo.exe and the likes. Occasionally used by System Administrators and in isolation they are harmless – but more than one of these EXEs run in close succession can be suspicious and should trigger a review. Furthermore, some EXEs are more dangerous than others which the threat score can reflect. Running ipconfig.exe should have a lower threat score than wmic.exe.
The most obvious application for threat scoring will be event id 4688 which is logged when a new process is started, but it can be applied to any type of event – e.g. Logon events, Sysmon events and others.
Anomaly Detection v2: Fewer false positives
Anomaly detection, introduced in v5.1 is an easy way to flag potentially suspicious activity or detect previously unseen patterns: Logons from new users, new processes and more. For some use cases, like detecting new processes, anomaly detection could result in false positives. For example, a never-before seen process on Host A could be triggered again on Host B – since the anomaly engine run independently on each end point (agent).
In v5.2 anomalies can now be filtered on the collector, reducing most false positives if they occur on more than one host. Taking the previous example, the collector would suppress the “anomaly” flag on Host B since it was already registered by Host A earlier.
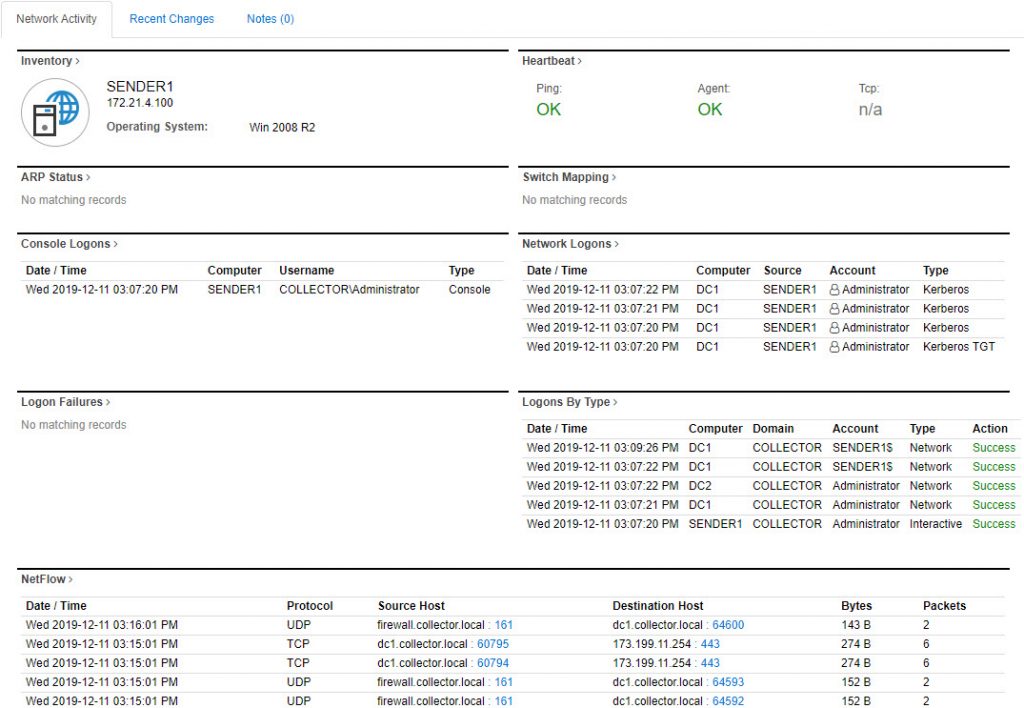
Searching Process Activity
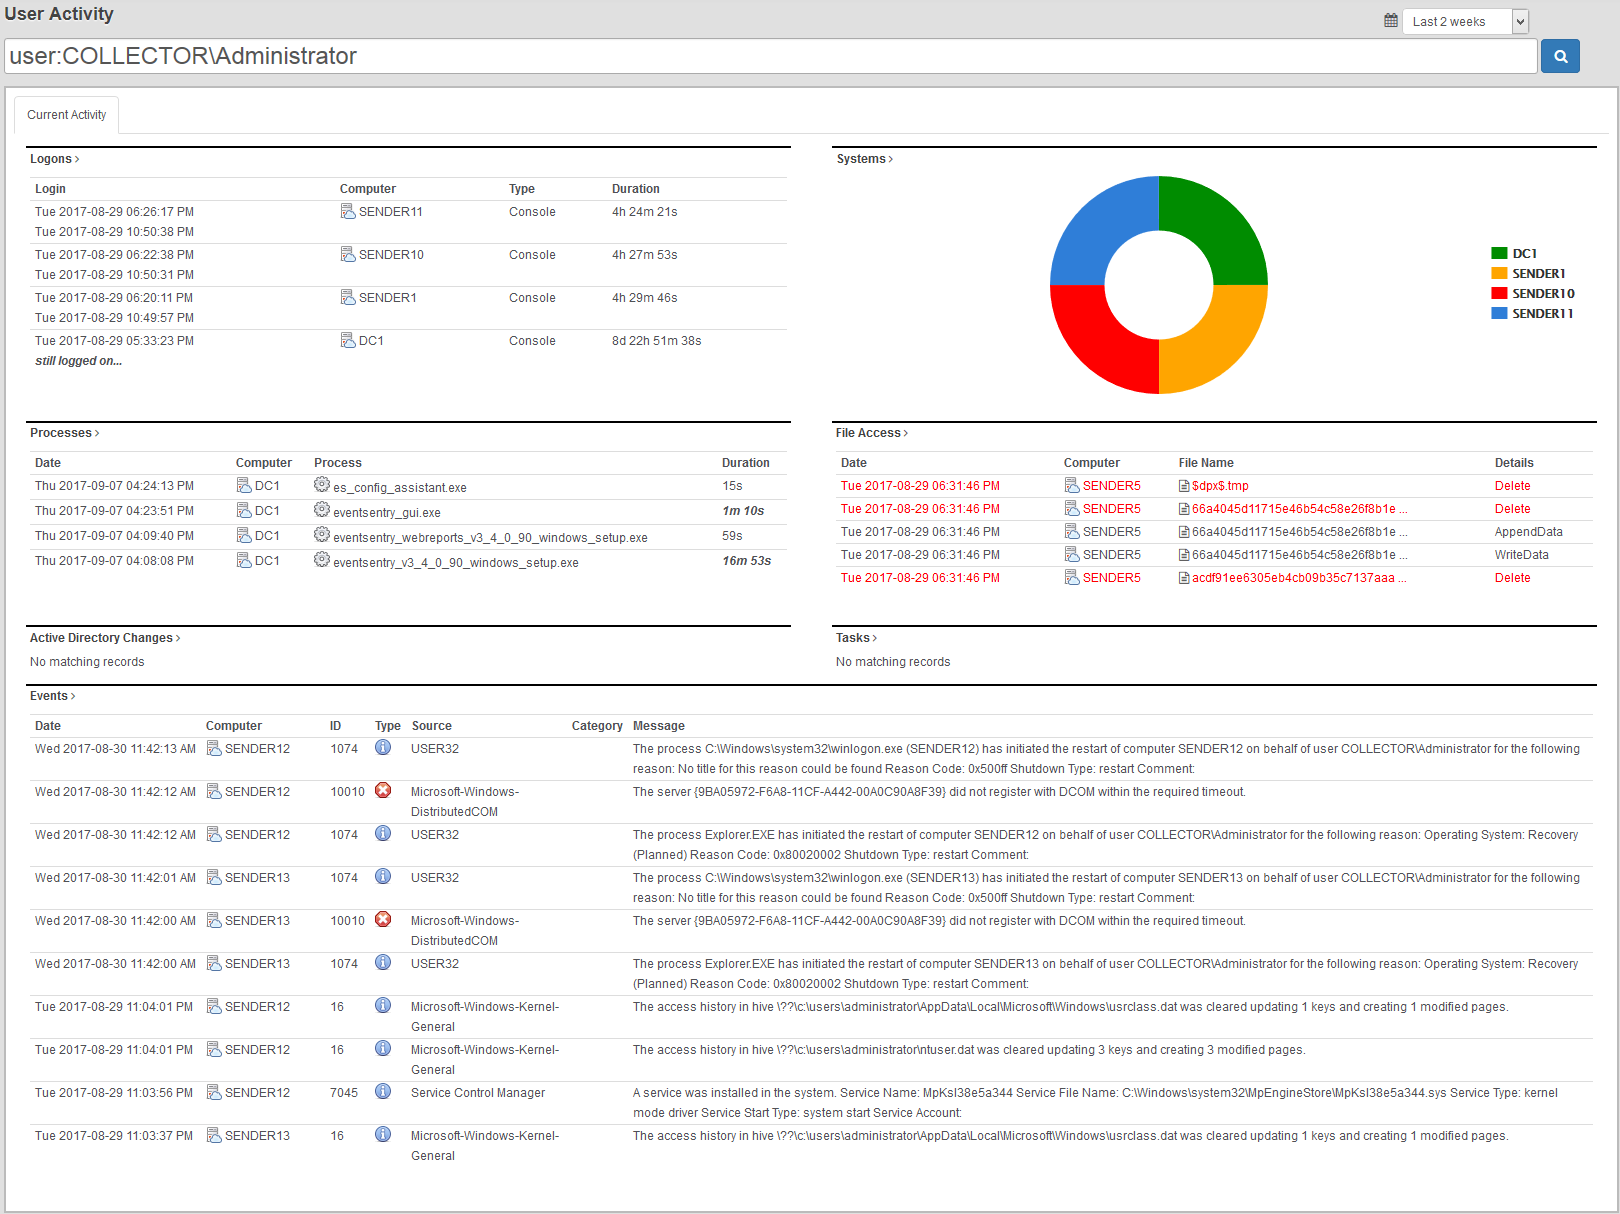
Since EventSentry collects various process activity and information on multiple pages (process tracking, Sysmon, process status w/ netstat, services, …), adding a hybrid “Process Activity” page – similar to the current IP Activity & User Activity pages – became a necessity. This makes identifying (suspicious) processes extremely easy and fast – even stepping backwards through the parent processes. Process Activity supports searching through common process properties like process executable, PID and searches the following areas:

- Currently Active Processes
- Process Activity (Tracking & Sysmon)
- Processing listening for incoming network connections
- Services
Other New Features
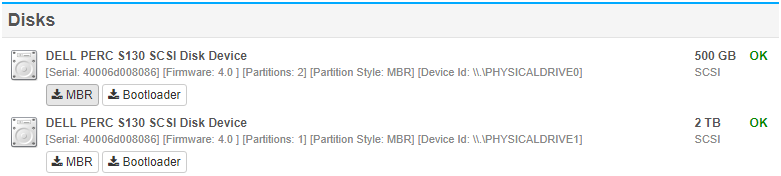
- Newly attached USB/BT keyboards are now detected and listed on the host inventory
- Collector Client supports port knocking
- Collector support for Process action
- Process Spoofing Detection (identifying processes pretending/masquerading to be part of Windows)

Web Reports
PWA Support
On Chrome and Edge web browsers, the web reports can now be run as a “Progressive Web Application”, which delivers an app-like experience of the EventSentry web reports on desktops.
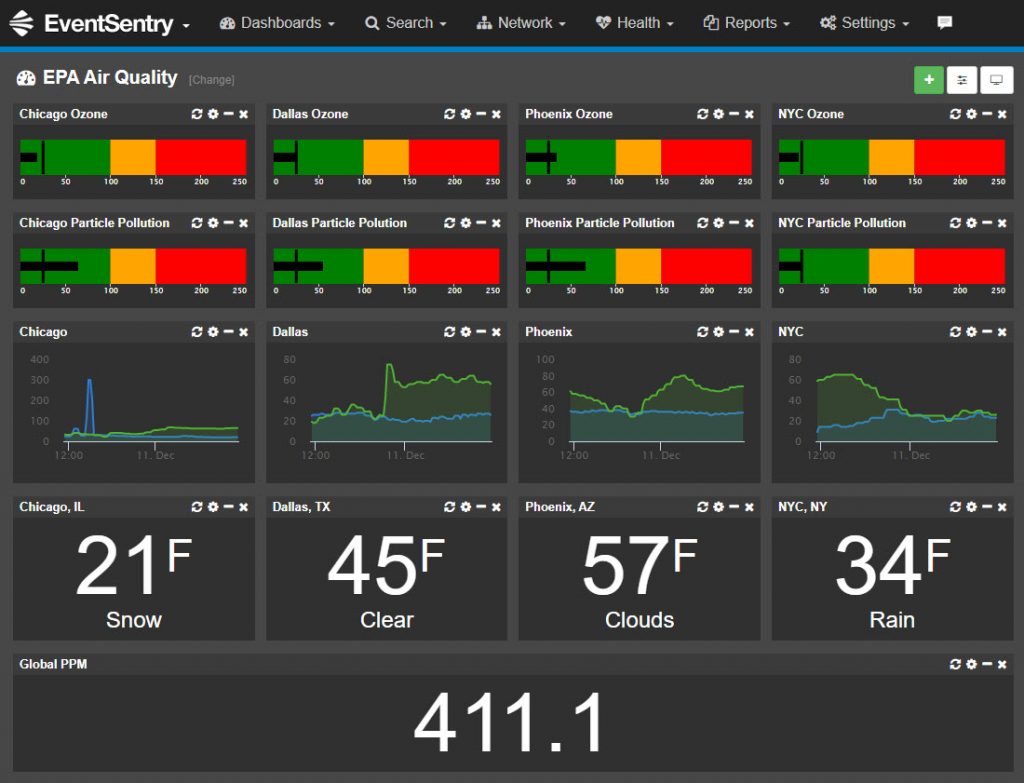
Dashboard Tiles
The Acknowledge Tile has been improved to support different output styles as well as queries, allowing users to create multiple tiles for different purposes.
Syslog RegEx Support
Since Syslog messages tend to be unformatted and, as such, sometimes difficult to interpret, the Syslog search now supports overlaying RegEx queries to format Syslog messages. This was previously only supported in the dashboard.
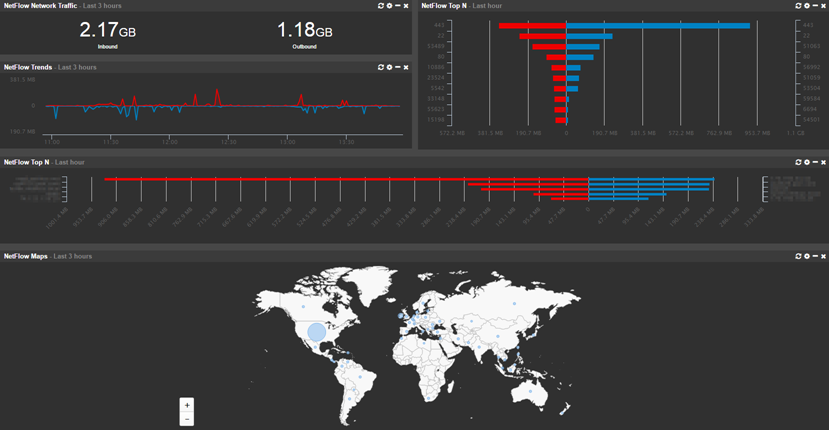
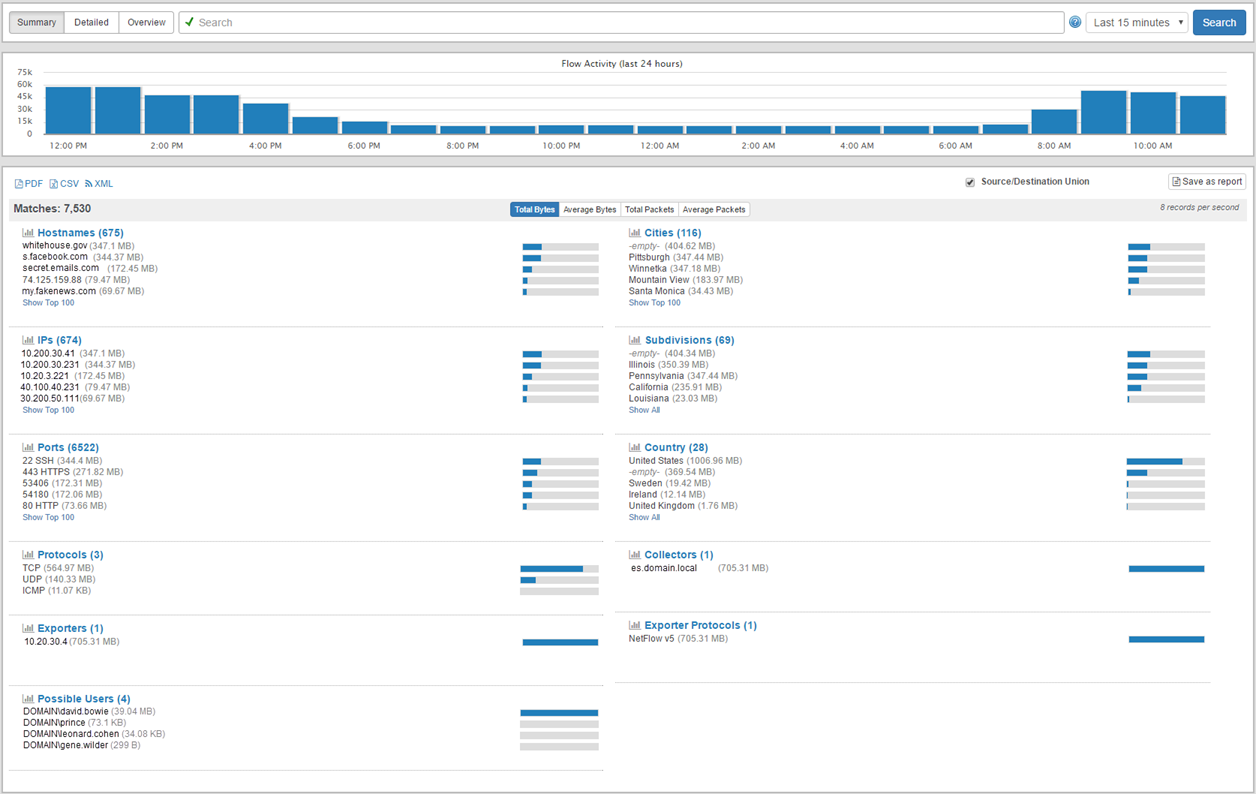
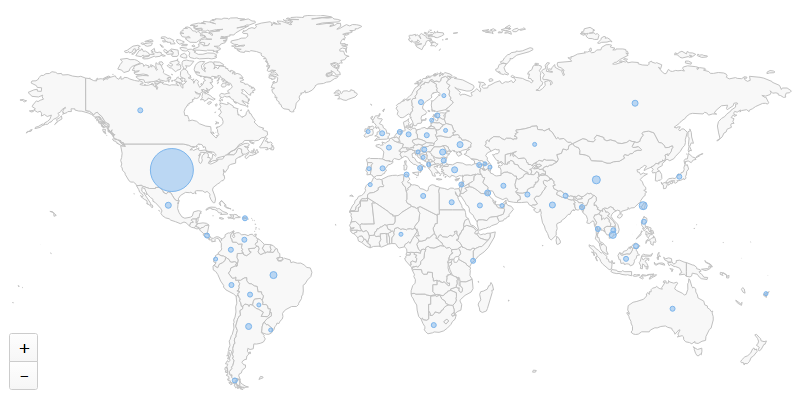
NetFlow Top Connections
This new NetFlow tile vividly displays your network’s key host connections. Uncover traffic patterns effortlessly and group data by IP address, hostname, country, and more for actionable insights.

Other Web Reports Improvements
- Improved Dashboard Manager with Sorting
- 2FA Email Authentication
EventSentray
The task-bar utility which can be automatically deployed with the agent and is also available in the free Sysadmin Tools, now includes an activity dialog which displays real-time information about process, file, scheduled tasks & service activity. But that’s not all – the new process/service dialog allows for conveniently terminating processes and controlling services.