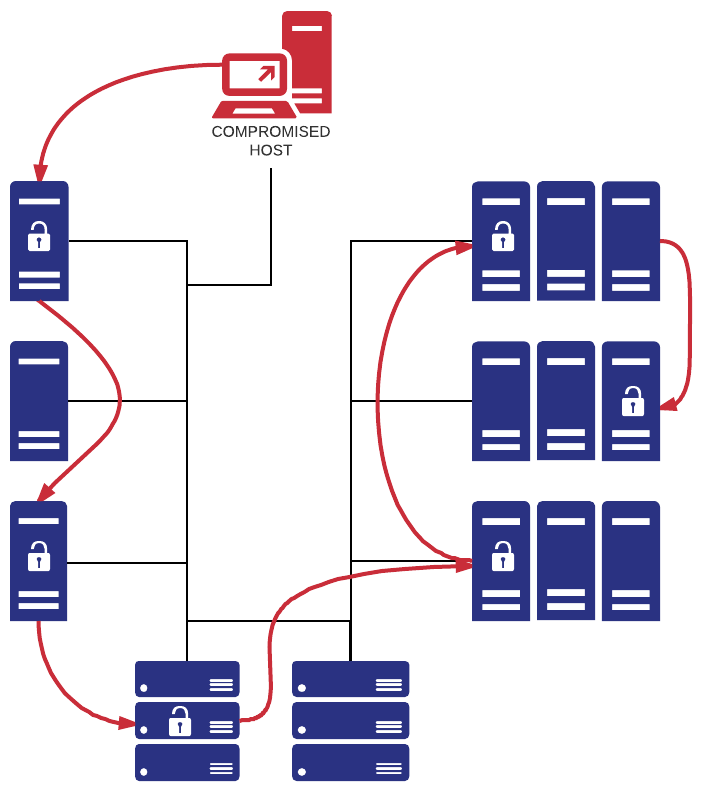
Imagine someone getting the seemingly innocent ability to run a couple of commands on a machine on your network WITHOUT installing any new software, but those commands resulting in a reverse shell running on that same machine – giving the intruder a convenient outpost in your network. Now stretch your imagination even further and pretend that all of this happens without leaving any unusual traces in logs – leaving you completely in the dark. It’s like somebody living in your house or apartment yet you have no idea they’re there. Are you getting goose bumps yet?
Not too long ago I talked with Michael, the creator of the popular cheat sheets which cover PowerShell, the Windows Registry, Windows Logging, and more. Michael ran a few scenarios by me that involved exploiting PowerShell and was curious how EventSentry could help detect those. This really sparked my interest in the topic, and after coming up with a few RegEx expressions that could be used in an EventSentry filter I decided to look more into this subject. I really have to take the opportunity to thank Michael here, whose cheat sheets and input helped me come up with this article and the new PowerShell Security event log package in EventSentry.

If you’re not an InfoSec professional then you may not be fully aware that PowerShell – you know, the language you’re supposed to be fluent in by now – is quite commonly used in attacks. In fact, InfoSec already reported back in 2016 that 38% of all attacks utilize PowerShell in one way or another. And let’s be honest – why wouldn’t you utilize a tool that is pretty much guaranteed to be installed while giving you full access to the .NET Framework and all Windows APIs? So if you haven’t already done so, then securing PowerShell in your environment is something you should think about sooner rather than later. This and the follow-up articles will assist you with this effort.
So what’s so potentially bad about PowerShell in particular? Now, Windows has always shipped with VBScript, a scripting language that’s easy to use for both simple and potentially more complex tasks. In fact, most of the things people do in PowerShell can be done with VBScript just the same. A key benefit of PowerShell, however, is the ability to utilize the .NET framework, something VBScript can’t since it can only interact with COM objects. And since PowerShell is, well, a shell, you get to pipe input/output and create powerful one-liners. On top of that, PowerShell contains some nifty features like encoding scripts, making it possible to run fairly complex code without ever having to use an actual .ps1 script file on disk. It’s VBScript on Steroids.
Here are some concrete examples as to what evildoers can do with PowerShell:
-
- Reverse Shell
- Download malicious payload and execute
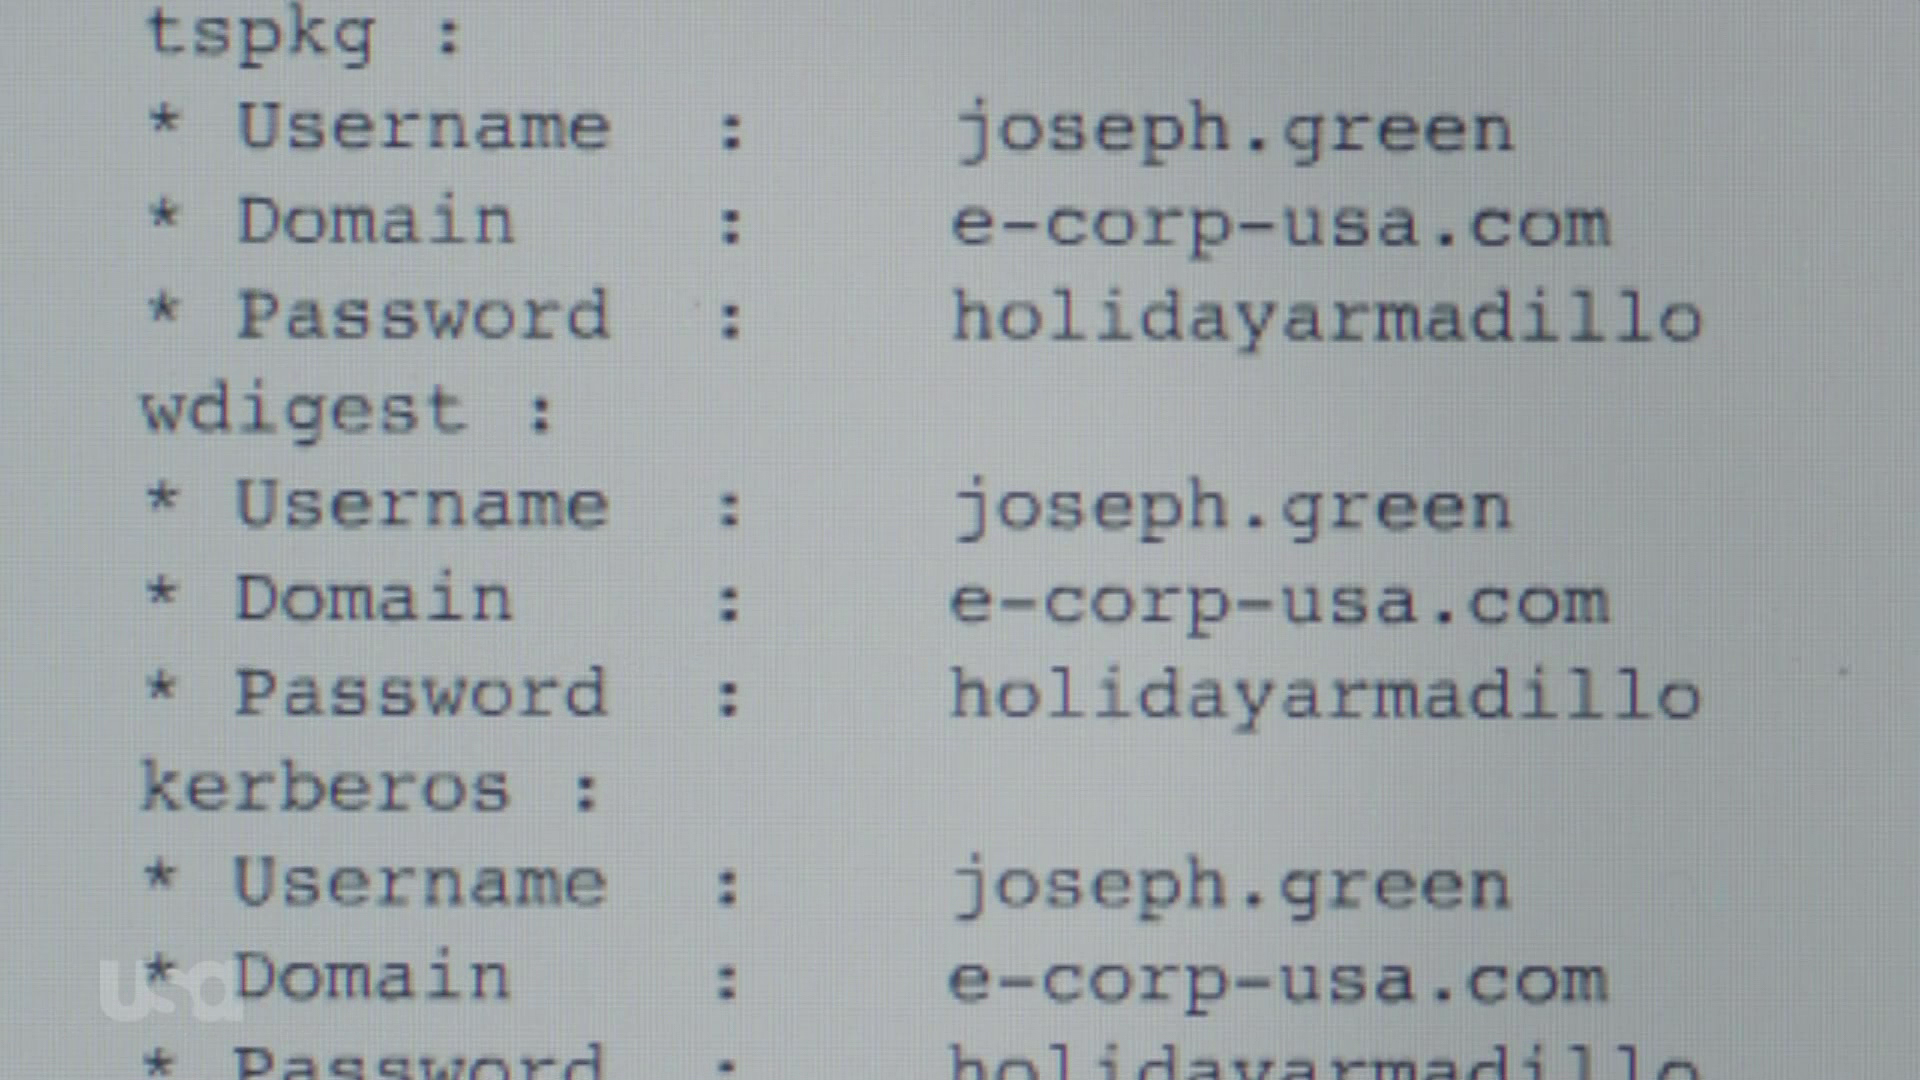
- Mimikatz
- UAC Bypass
- Embed PowerShell scripts in images
- Bypass UAC and quietly run scripts elevated
- Write a complete RansomWare implementation in PowerShell
- Fileless attacks
- and boatloads more
Here is a list of sites hosting “aggressive” PowerShell code and frameworks:
- PowerShell Empire
- PowerSploit
- NiShang
- PS> Attack
PowerShell Versions
Remember when I talked about “without leaving a trace” above? That’s because Microsoft didn’t introduce the ability to log detailed PowerShell activity until version 5, although PowerShell 3 & 4 generate reasonably useful audit logs as well. In order to protect ourselves against PowerShell attacks, we need to first detect it, which we can only do if PowerShell leaves traces. PowerShell’s ability to produce useful audit logs greatly depends on the version, however, which the table below illustrates:
- Which version of Windows ships with which version of PowerShell
- What is the highest supported version of PowerShell for each version of Windows
For more information on version differences also see Differences between PowerShell versions.
|
PowerShell Version
|
Release Year
|
Windows Version
|
Prerequisites
|
| 1.0 | 2006 | Windows Server 2008 | None |
| 2.0 | 2009 | Windows 7 Windows Server 2008 R2 |
Microsoft .NET Framework 2.0.50727 |
| 3.0 | 2012 | Windows 8 Windows Server 2012 |
Microsoft .NET Framework 4 |
| 4.0 | 2013 | Windows 8.1 Windows Server 2012 R2 |
Microsoft .NET Framework 4.5 |
| 5.1 | 2017 | Windows 10 | Microsoft .NET Framework 4.5.2 |
| 5.1 | 2017 | Windows Server 2016 | Microsoft .NET Framework 4.5.2 (already installed in 2012 and later) |
| 5.1 | 2017 | Windows Server 2019 | Microsoft .NET Framework 4.5.2 (already installed in 2012 and later) |
|
All versions of Windows since Server 2008 and the version of PowerShell that it included by default
|
|||
|
Windows Version
|
PowerShell Version
Included With Windows |
Highest Supported
PowerShell Version |
| Windows Vista (SP2) | 2.0 | 2.0 |
| Windows Server 2008 (SP2) | 2.0 | 3.0 |
| Windows 7 (SP1) | 2.0 | 5.1 / 7.0 Core |
| Windows Server 2008 R2 (SP1) | 5.1 | 5.1 / 7.0 Core |
| Windows 8 | 3.0 | 5.1 / 7.0 Core |
| Windows Server 2012 | 3.0 | 5.1 / 7.0 Core |
| Windows 8.1 | 4.0 | 5.1 / 7.0 Core |
| Windows Server 2012 R2 | 4.0 | 5.1 / 7.0 Core |
| Windows 10 | 5.1 | 5.1 / 7.0 Core |
| Windows Server 2016 | 5.1 | 5.1 / 7.0 Core |
| Windows Server 2019 | 5.1 | 5.1 / 7.0 Core |
|
Shows the versions of PowerShell that ship with Windows as well as the highest supported version of PowerShell
|
||
As you can see from the table above, thankfully most versions of Windows are compatible with PS v5, so unless you’re unfortunate enough to be running Server 2008 (or Vista), you should be able to deploy PowerShell 5.1 to most of your systems. I say most, because some Microsoft applications (e.g. Exchange Server 2010) aren’t compatible with PowerShell v5, so you’ll want to make sure you do some research on those machines that actively use PowerShell to prevent disruption.
Coexistence & Legacy
An important thing to note here is that PowerShell v1/v2 can peacefully coexist with PowerShell v3-v5, while versions 3 and later are always upgraded to the latest version. This means that you could have v2 and v4 installed (and many systems do), but not v3 and v5. What’s also interesting is that PS v2 is installed with every major version of Windows (including Server 2016!) although not usable until the .NET Framework v2.0.50727 is installed.
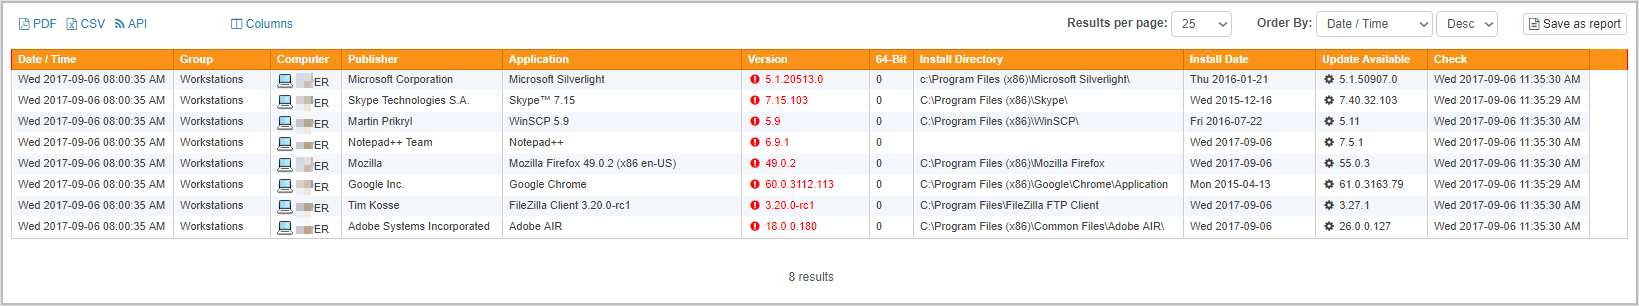
Starting with EventSentry v3.4.1.34 you can thankfully use EventSentry’s software inventory to determine which versions of PowerShell are installed on your network. If you haven’t manually deployed PS v5 yet and aren’t running Windows Server 2016 widely yet, then you will probably see PowerShell v2 and v4 installed on most hosts on your network. EventSentry’s grouping mechanism comes in real handy here.
Please note that even though PowerShell v2 may be installed on a machine it doesn’t necessarily mean that PowerShell v2 is actually usable. PowerShell relies on the .NET Framework being installed, and PowerShell v2 specifically relies on the .NET Framework 2.0.50727 (which is part of the 3.5 .NET Framework) – something that is usually not installed by default. I will explain later why this is a good thing.
OK, but enough about boring PowerShell versions. If you just remember one thing from the above tables and paragraphs it’s this:
- PowerShell v2: Ever prevalent & Bad!
- PowerShell v3, v4: Meh.
- PowerShell v5.1: Good!
Native PowerShell Event Logging
Since PowerShell v1.0 was first introduced with Windows XP – before the Application & Services logs were available – PowerShell likes to log to two different event logs – both of which you should monitor:
- Windows PowerShell
- Microsoft-Windows-PowerShell/Operational
Thankfully you don’t need version 5.x to get useful logging – even PowerShell v3 & v4 can log relevant details in the (Windows PowerShell) event log, e.g. the PowerShell command line or commands executed within the PowerShell shell. In fact, even the (decoded) commands are logged to the event log when obfuscated with the -encoded switch.
Logging Options
Logging can be enabled either through group policy or via registry settings. There are three general areas for logging available:
- Module Logging
- Script Block Logging
- PowerShell Transcription
Module Logging
Since everything that is executed in PowerShell is essentially located in a module, module logging will at least generate a high-level audit trail of PowerShell activity and potentially malicious activity. At minimum this will show which commands were executed through PowerShell. This logging level should always be enabled and is useful starting with PS version 3.
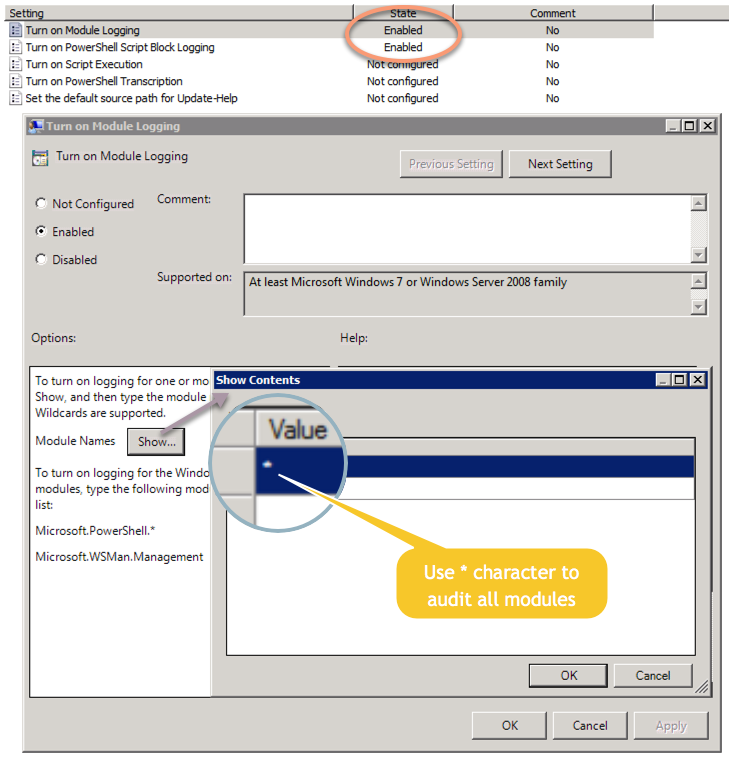
Important: Module Logging only works if you specify at least one module to be monitored. Since it’s difficult and cumbersome to predict and edit a list of all modules that could potentially cause harm, I recommend just specifying the * wildcard characters as the module list – see screenshots below.
Script Block Logging
Script Block Logging is more verbose than module logging and provides additional context and output, especially when functions are called and function output itself is invoked as a command. The amount of noise heavily depends on the type of PowerShell activity, but I’d recommend turning this option on as well. If it ends up producing too much noise / volume it can always be disabled or customized later.
Transcription
This provides a full log of all input and output and requires additional considerations in regards to where the transcription files are placed. I’d only recommend this for high-secure environments, you can learn more about it here. Transcript files are stored in the file system, so it’s a little more work than just adding up a couple of registry values. If you enable this feature then you’ll need to make sure that the actual transcript files (which likely contain sensitive data) are protected from unauthorized access.
Enabling Logging
It’s definitely recommended to configure these options via Group Policy to ensure that all machines in the domain receive the settings. If changing group policy is not an option in the short term then you can at least set the registry options until you have an opportunity to set it via group policy. You can use a tool like the EventSentry Admin Assistant to push registry settings out to multiple hosts with just a few clicks.
Group Policy: Configuring this is unfortunately less straightforward than you’d think or expect, depending on the OS version of your domain controller. You can expect the “Module Logging” option to be available in the group policy editor on 2008 R2 and later, however “Script Block Logging” is only available on server 2016 or after manually updating ADMX files. See this thread on how to update your ADMX files. In my environment I just had to replace the PowerShellExecutionPolicy.admx and en-US\PowerShellExecutionPolicy.adml files in the %SYSTEMROOT%\SYSVOL\sysvol\[DOMAINNAME]\Policies\PolicyDefinitions directory with the newer versions after installing the latest version from here.
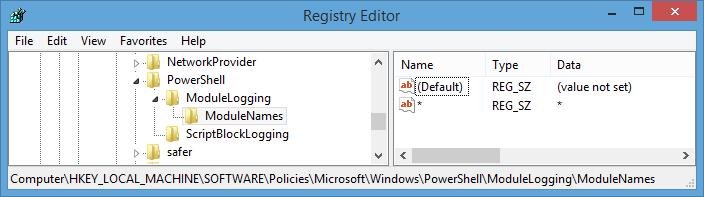
Registry: Only the HKEY_LOCAL_MACHINE\SOFTWARE\Policies\Microsoft\Windows\PowerShell key exists by default, the other two sub keys “ModuleLogging” and “ScriptBlockLogging” have to be created before you can add the “EnableModuleLogging” and “EnableScriptblockLogging” DWORD values inside those sub keys.
For Module Logging, as shown in the screenshot below, you’ll also need to create the “ModuleNames” sub key along with a list of modules that will be monitored. I recommend just using the asterisk character which monitors any module.
|
|
Registry
|
Group Policy
|
| Module Logging | Key: HKLM\SOFTWARE\Policies\Microsoft\Windows\PowerShell\ModuleLogging Name: EnableModuleLogging Data: 1 (DWORD)Key: HKLM\SOFTWARE\Policies\Microsoft\Windows\PowerShell\ModuleLogging\ModuleNames Name: [ModulePattern] Data: [ModulePattern] (REG_SZ)See the screenshot above for example on module logging. |
Policies\Administrative Templates\Windows Components\Windows PowerShell\Turn on Module Logging |
| Script Block Logging | Key: HKLM\SOFTWARE\Policies\Microsoft\Windows\PowerShell\ScriptBlockLogging Name: EnableScriptBlockLogging Data: 1 (DWORD) |
Policies\Administrative Templates\Windows Components\Windows PowerShell\Script Block Logging |
|
|
||
You don’t need to restart after setting the registry values, they will become effective immediately. The same applies to group policy – as soon as the target host has applied the group policy settings, PowerShell will enforce the new logging options.
PowerShell logs a lot of different events to two different event logs, and the table below shows the events I have observed on test systems. Even though the table may not be 100% complete, it does list all the events that are relevant for threat detection. If an event is not listed below then it is likely not relevant for forensics. We will update the list if necessary.
|
Event ID
|
v2
|
v3
|
v4
|
v5
|
Correlate
|
Auditing
|
Notes
|
| 400 | X | X | X | X | 403 | Always logged, regardless of logging settings | This even can be used to identify (and terminate) outdated versions of PowerShell running. |
| 403 | X | X | X | X | 400 | Always logged, regardless of logging settings | |
| 500 | X | X | X | X | 501 | Requires $LogCommandLifeCycleEvent = $true in profile.ps1 | This event is largely useless since it can be bypassed with the -nop command line switch |
| 501 | X | X | X | X | 500 | Requires $LogCommandLifeCycleEvent = $true in profile.ps1 | This event is largely useless since it can be bypassed with the -nop command line switch |
| 600 | X | X | X | X | 500 | Always logged, regardless of logging settings | |
| 800 | X | X | X | 500 | ModuleLogging | This event is inconsistently logged with PowerShell V3 | |
|
Event ID
|
v2
|
v3
|
v4
|
v5
|
Correlate
|
Auditing
|
Notes
|
| 4100 | X | Logged when PowerShell encounters an error | |||||
| 4103 | X | X | ModuleLogging | May be logged along with 500 & 501 | |||
| 4104 | X | ScriptBlockLogging | |||||
| 40961 | X | X | X | Always logged, regardless of logging settings | |||
| 40962 | X | X | X | Always logged, regardless of logging settings | |||
What’s interesting to note is that newer versions of PowerShell will often log to both event logs simultaneously.
Security Event Log Auditing
PowerShell logging is great, but given the discrepancies between the different versions and the possibility to evade it (more on that later), I prefer to have as many methods as possible at my disposal that tell me what PowerShell is doing.
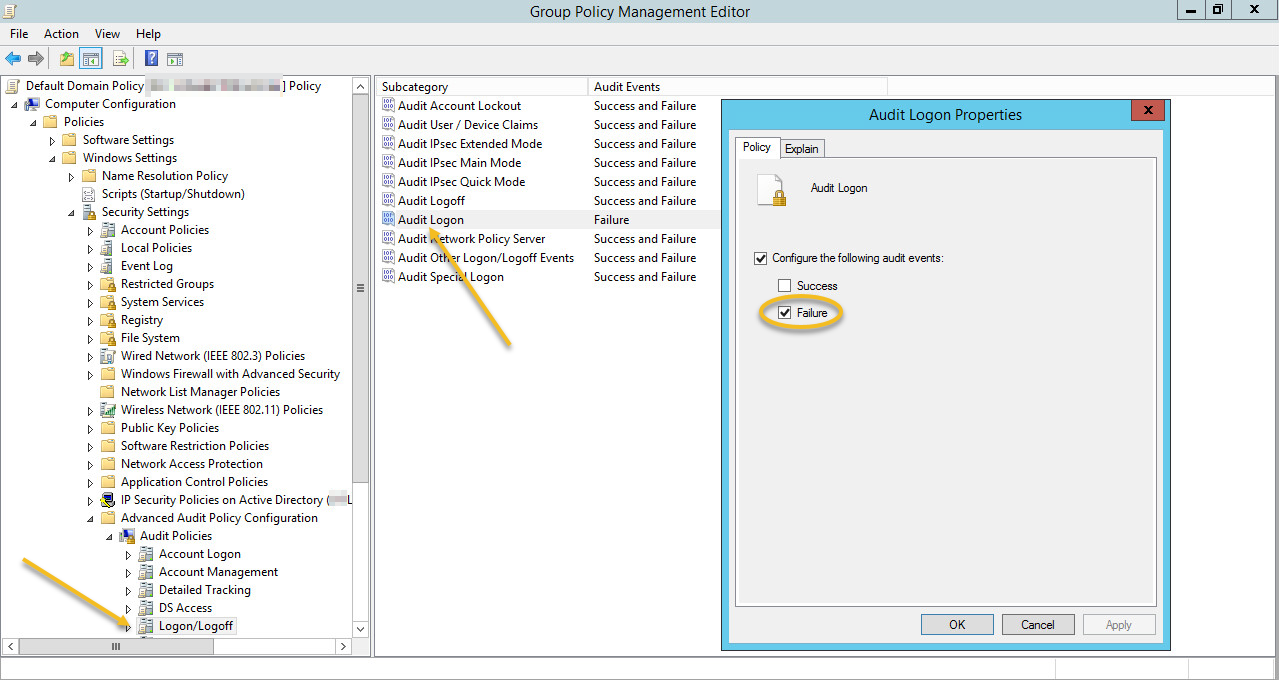
Since PowerShell code is usually invoked via powershell.exe (I’m point this out because you technically don’t have to use powershell.exe, and attackers are coming up with creative ways to launch it through other ways – more in part 2 of this series), and because we’re after that processes’ command line, it’s important to monitor Process Start (event id 4688) events from the security event log in addition to events logged by PowerShell itself. This means you’ll need audit the following sub categories from the Detailed Tracking category:
- Process Creation: Success and Failure (event id 4688)
- Process Termination: Success and Failure (event id 4689)
If you are not using EventSentry then I recommend collecting both 4688 and 4689 events so that you can not only determine whether a powershell.exe process was started, but also how long it remained active. If you are an EventSentry user then you just need to verify that Process Tracking (an object for Compliance Tracking) is enabled and configured to capture the command line of a process. EventSentry can automatically parse and correlate 4688 and 4689 events and provide a history of all processes on a monitored system.
EventSentry users can also utilize the Audit Policy Status page to verify that process creations are indeed being audited. You’ll also want to make sure that “Include command line in process creation events” is activated, so that Windows logs the command line of every process as part of 4688 events. After all it doesn’t help us that much just knowing that powershell.exe has been running, we need to know what exactly it has been running.
This can either be enabled via group policy (Administrative Templates\System\Audit Process Creation\Include command line in process creation events) or via the registry (set HKLM\Software\Microsoft\Windows\CurrentVersion\Policies\System\Audit\ProcessCreationIncludeCmdLine_Enabled to 1).
Disclaimer: This option is available starting with Windows 7 / Server 2008 R2, earlier versions of Windows don’t support it. Things are a little easier for EventSentry users, which attempts to obtain the command line of a process if it’s not included in the 4688 event and subsequently makes it available as variable $STR9. But more on that in part 2 when we discuss ways to detect and mitigate attacks.
I hope I was able to convince you of the risks that PowerShell poses, what versions of PowerShell are out there, and what type of logging needs to be enabled in order to detect and stop malicious PowerShell in its tracks. In part 2 I’ll talk about how to actually mitigate PowerShell-based attacks – with specific instructions for EventSentry.