Auditing DNS Server Changes on Windows 2012 R2 and later with EventSentry

Auditing changes on Microsoft Windows DNS server is a common requirement and question, but it’s not immediately obvious which versions of Windows support DNS Auditing, how it’s enabled, and where the audit data (and what data) is available. Fortunately Microsoft has greatly simplified DNS Server auditing with the release of Windows Server 2012 R2.

In this post we’ll show how to enable DNS Auditing on 2012 R2 and later, and how to configure EventSentry to collect those audit events. In a future post we’ll also show how to do the same with older versions of Windows – 2008, 2008 R2 & 2012.

When configuration is finished you are going to be able to see when a zone/record is created/modified/deleted as well as by whom. The audit data will be available (and searchable) in the EventSentry Web Reports, and you’ll also be able to setup email alerts when some or all DNS entries are changed.

Prerequisites

Since native DNS auditing was only introduced with Windows 2012 R2 or later you’ll need to run at least Windows Server 2012 R2 in order to follow this guide. The table below shows the types of DNS auditing available on Windows Server Operating Systems:

Windows OS Auditing Type Comments
Windows 2008 Active Directory – based auditing only
Windows 2008 R2 Active Directory – based auditing only
Windows 2012 Active Directory – based auditing only
Windows 2012 R2 Native DNS Auditing Available with hotfix 2956577
(automatically applied via windows update!)
Windows 2016 Native DNS Auditing enabled by default
Windows 2019 Native DNS Auditing enabled by default
Windows 2022 Native DNS Auditing enabled by default

Configuration

Enhanced DNS logging and diagnostics are enabled by default in supported versions of Windows Server when the “DNS Server” role has been added to Windows, so there are no additional configuration steps that need to be done.

1. Package Creation

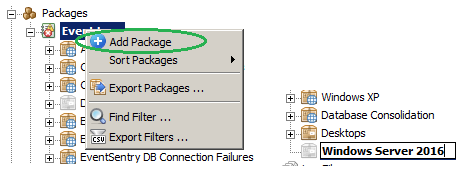
On the EventSentry machine we are going to add a package under Packages/Event Logs by right-clicking “Event Logs” and selecting “Add Package”. In this example we are going to call the package “Windows Server 2016”:

Package Creation
Package Creation

2. Adding a Filter

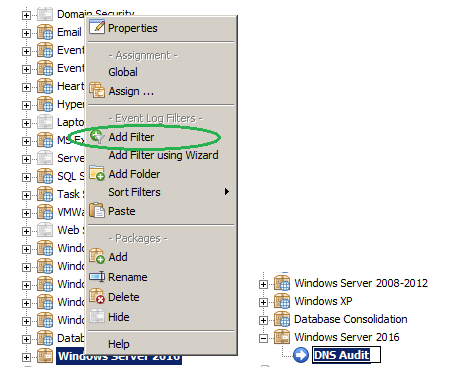
The next step is to add a filter to the previously created package “Windows Server 2016”. Right click the package and then select “Add Filter”.

Adding a DNS Audit filter
Adding the DNS Audit filter

Note: For a short tutorial on how to create a filter click here.

3. Filter Configuration

There are several ways to approach the filter configuration depending on your needs. As a reminder, a filter is a rule in EventSentry that determines to where an event is forwarded to, or how it is processed.

  1. Collect all or select (e.g. creation only) DNS audit data in the database
  2. Email alert on select audit data (e.g. email all deletions)
  3. Email alert on all activity from a specific user

In this guide we will show how to accomplish (1) and (2) as a bonus.

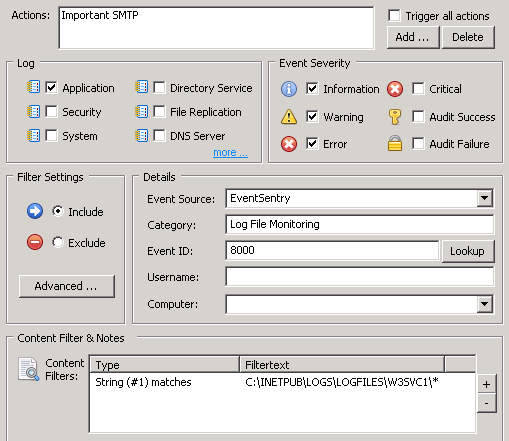
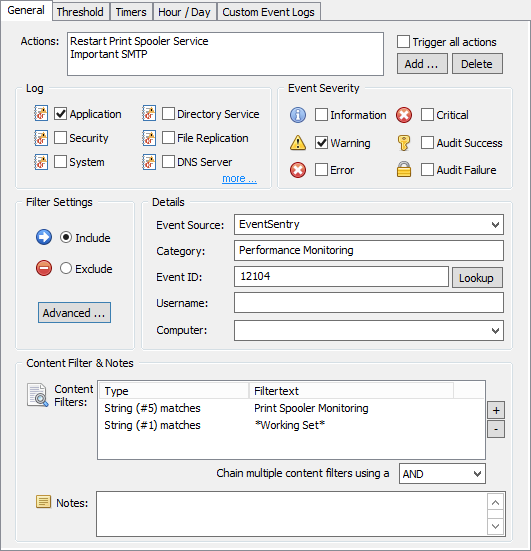
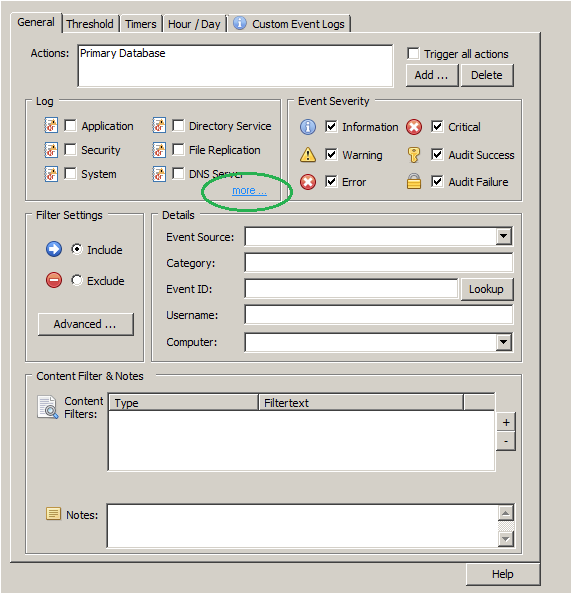
On the right pane of the management console after the creation of the filter you will see the General tab of the new filter. We decided to configure it to log to the Primary Database, but the events can be sent to any action (Email, Syslog, …).

Under “Event Severity” we check all boxes since we want to log everything (it’s important to check “Information” since most of the creation/deletions/etc are logged at this level of severity).

Editing the DNS Audit filter

4. Adding a custom event log

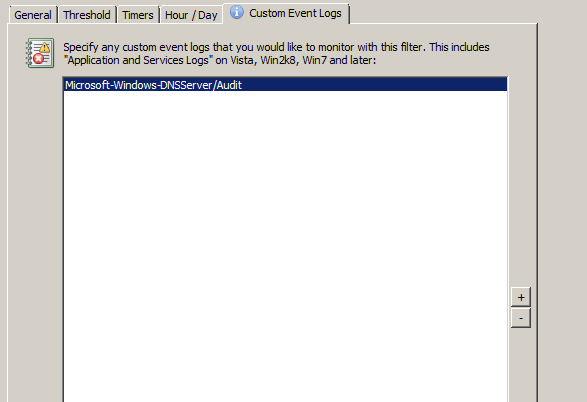
In the “Log” section click on “more” to jump to the “Custom Event Logs” tab (or, just click on that tab). Now we need to add the Microsoft-Windows-DNSServer/Audit event log to the list of custom event logs so that this filter picks up events from the DNS Audit event log. Click the save button in EventSentry Management Console title bar to save the changes we’ve made so far.

Adding an Application & Services event log

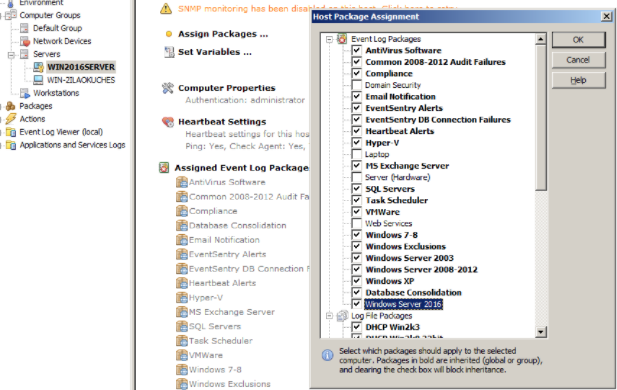
5a. Assigning the package (method A – manual assignment)

To assign the package, select the server you would like to assign it to and select “Assign Packages”. In the resulting dialog simply check the box next to the package we created in step 1. Alternatively you can also select the package and click “Assign” from the ribbon (or context menu) and select a group or host(s) to assign the package to.

Assigning a package
Assigning a package

5b. Assign the package (method B – dynamic activation)

Instead of assigning the package manually, the package can be assigned dynamically so that any host monitored by EventSentry running Windows Server 2012 R2 or later will automatically have this package assigned. To dynamically assign a package do the following:

  • Click the package and select “Properties” from the ribbon, or right-click.
  • In the “Dynamic Activation” section, check “Automatically activate …”
  • In the “Installed Services” field enter “DNS”
  • For the “Operating System”, select “at least” and “Windows 2012 R2”
  • Click the “Global” icon in the ribbon to make sure the package gets assigned to all hosts. Don’t worry, it will still only be activated on 2012 R2 or later hosts that have the DNS server running

6. Saving

After assigning the package and saving the configuration click “Save & Deploy” or push the configuration to all remote hosts. Please note that only new events generated in the DNS Audit Log will be processed, pre-existing log entries will be ignored.

Testing the Configuration

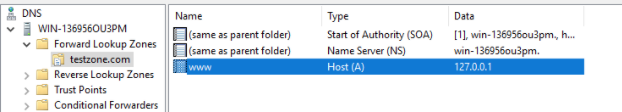
To test the configuration we will create a domain called “testzone.com” and add an A record called www on the monitored DNS server. We’ll then check if those modifications are visible in the EventSentry Web Reports. The screenshot below shows the new A record in the DNS console:

testzone.com with the new A record "www"
testzone.com with the new A record “www”

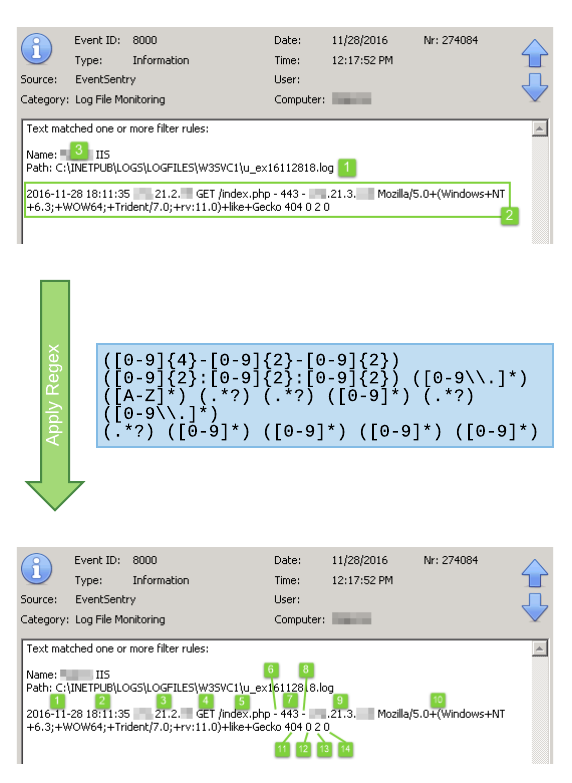
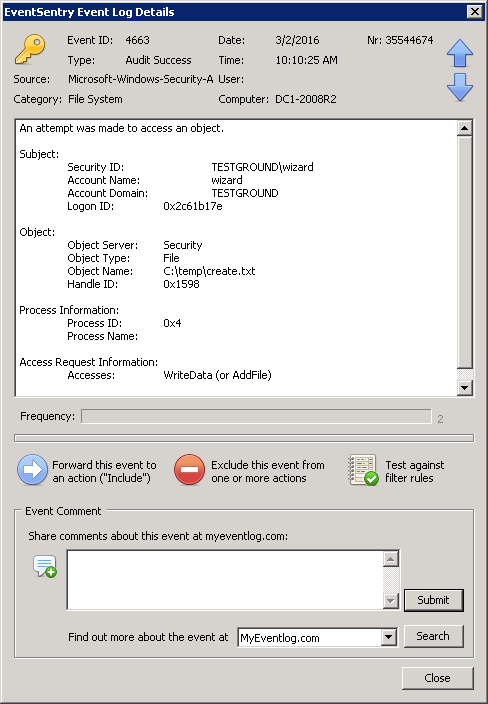
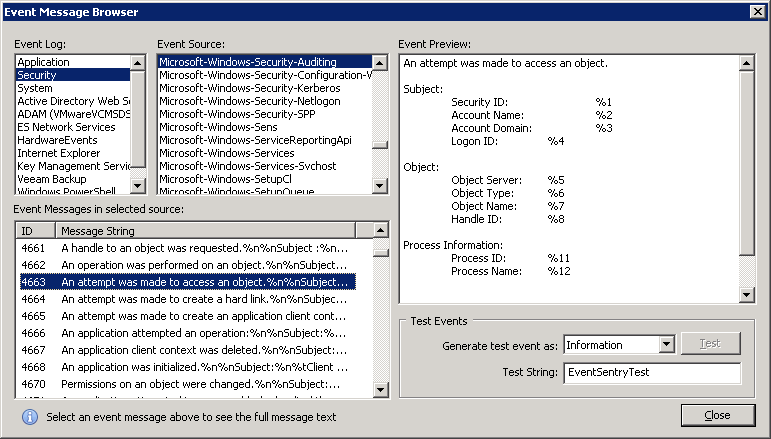
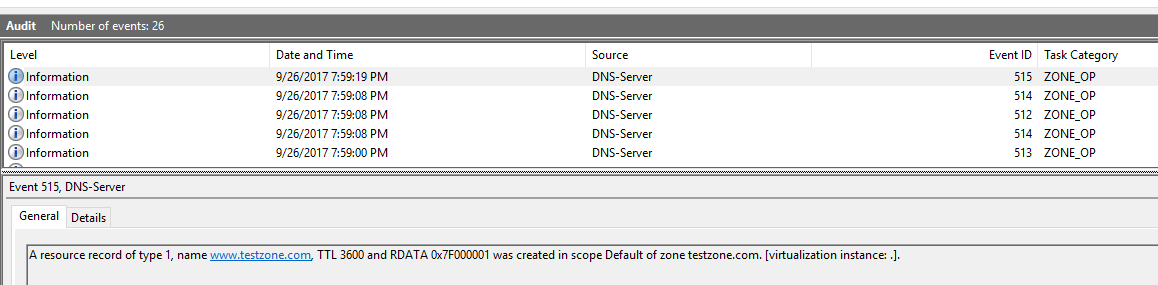
First, lets take a look to see what the actual DNS Audit entries look like (using the Windows Event Viewer: Applications and Services Logs/Microsoft/Windows/DNS-Server/Audit):

DNS Server Audit Event Log

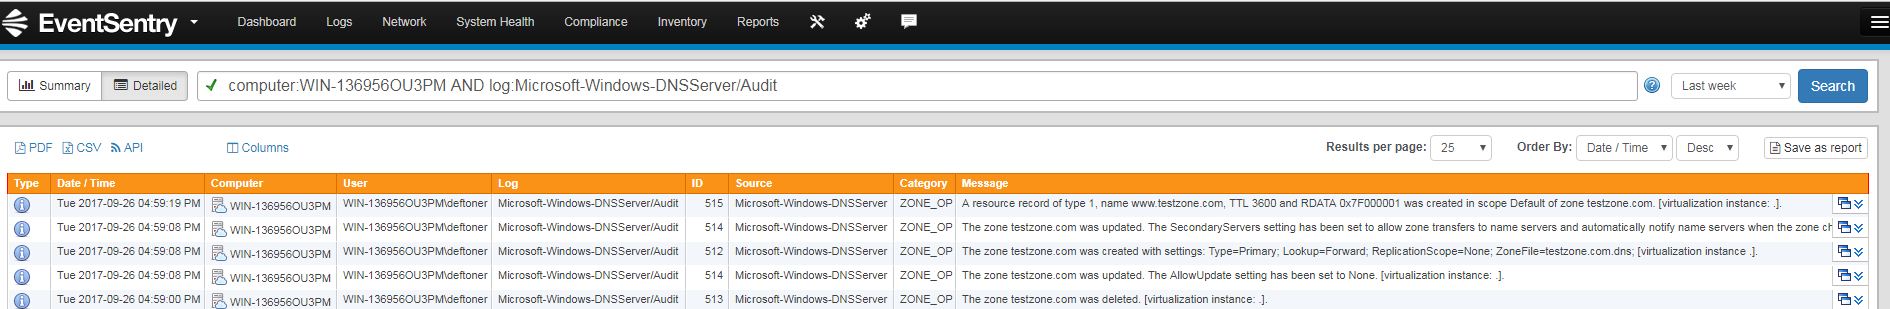
In the EventSentry Web Reports, navigate to Logs/Event Log and filter by the log “Microsoft-Windows-DNSServer” and then select “Detailed”. You should see all the modifications that were performed:

Detailed audit log in the web reports

Bonus Track: Configuring alerts for a specific change

The first part of this post was purposely generic in order to understand the basics of monitoring your DNS Server. But as a bonus we’ll show how to monitor a specific change (in this case a creation) and trigger an email alert for that.

The process is the same as explained in the beginning:

  1. Create a new filter and add it to the same package. The filter should be configured exactly the same way. To make things easier, you can also copy & paste the filter with the familiar Copy/Paste buttons in the ribbon or context menu.
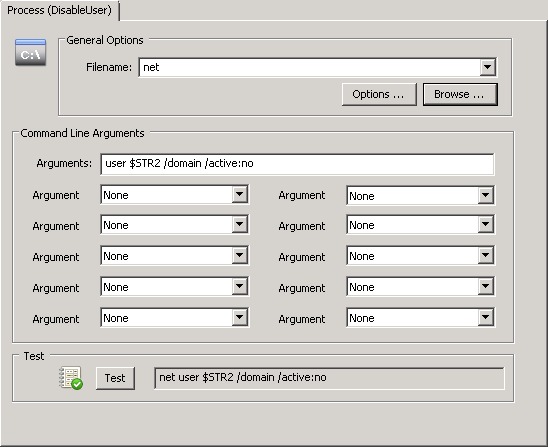
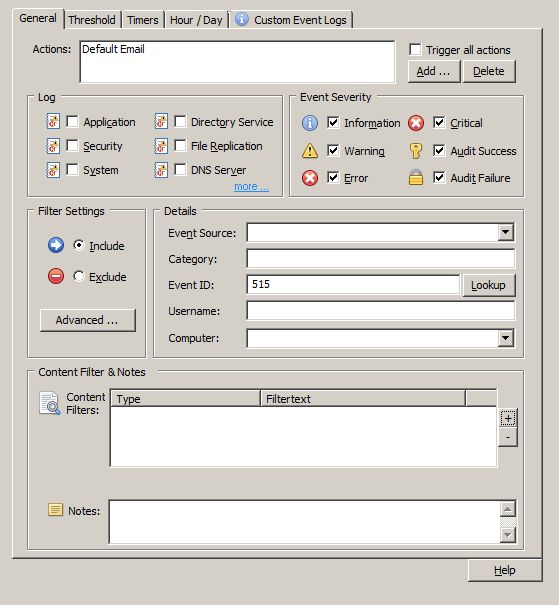
  2. This time however we specify the “Default Email” action in “General” tab so that we receive an email alert when the filter criteria matches an event.
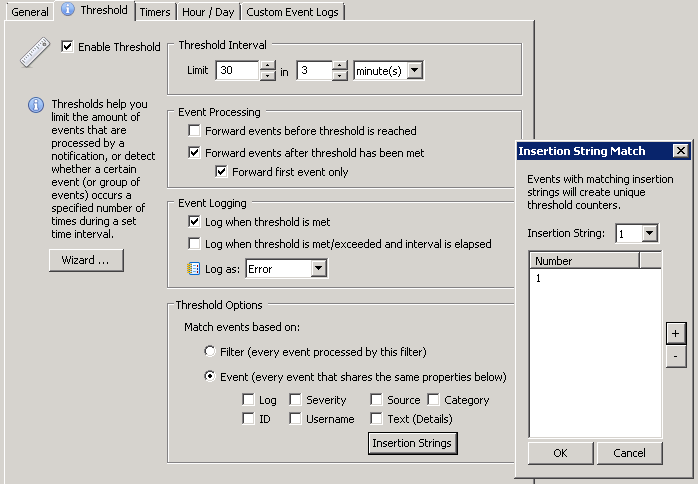
  3. In the “Details” area specify event id 515 in the “Event ID” field, which is the event id corresponding to the creation of a new record. This is how the filter would look like:
Filter for receiving an alert on record creation

Filters can of course be more specific as well, it’s possible to filter based on the user or event content of the actual event. Below is a list of all audit events logged by the DNS Server:

Event ID Type Event ID Type
512 Zone added 551 Clear statistics
513 Zone delete 552 Start scavenging
514 Zone updated 553 Enlist directory partition
515 Record create 554 Abort scavenging
516 Record delete 555 Prepare for demotion
517 RRSET delete 556 Write root hints
518 Node delete 557 Listen address
519 Record create – dynamic update 558 Active refresh trust points
520 Record delete – dynamic update 559 Pause zone
521 Record scavenge 560 Resume zone
522 Zone scope create 561 Reload zone
523 Zone scope delete 562 Refresh zone
525 Zone sign 563 Expire zone
526 Zone unsign 564 Update from DS
527 Zone re-sign 565 Write and notify
528 Key rollover start 566 Force aging
529 Key rollover end 567 Scavenge servers
530 Key retire 568 Transfer key master
531 Key rollover triggered 569 Add SKD
533 Key poke rollover 570 Modify SKD
534 Export DNSSEC 571 Delete SKD
535 Import DNSSEC 572 Modify SKD state
536 Cache purge 573 Add delegation
537 Forwarder reset 574 Create client subnet record
540 Root hints 575 Delete client subnet record
541 Server setting 576 Update client subnet record
542 Server scope create 577 Create server level policy
543 Server scope delete 578 Create zone level policy
544 Add trust point DNSKEY 579 Create forwarding policy
545 Add trust point DS 580 Delete server level policy
546 Remove trust point 581 delete zone level policy
547 Add trust point root 582 Delete forwarding policy
548 Restart server
549 Clear debug logs
550 Write dirty zones

We hope that DNS changes will never remain a mystery after activating DNS auditing. Don’t fear if you’re running 2012 or earlier, the next post is on its way.

Mariano + Ingmar.

Agent vs Agentless: Why you should monitor (event) logs with an agent-based log monitoring solution

The debate as to whether agent-based or agent-less monitoring is “better” has been answered many times over the years in magazine / online articles, blog posts, vendor white papers and others. Unfortunately, most of these articles are often incomplete, inaccurate, biased, or a combination thereof.

To make things slightly more confusing, different ISV use different methods for monitoring servers and workstations. Some use agents, some don’t, and a small few offer both both methods. But what is ultimately the best method?

What are you monitoring?

First it’s important determine what is being monitored to determine whether an agent-based or agent-less approach is better. For example, collecting system metrics like performance data usually creates fewer challenges then transmitting large amounts of (event) log data. Furthermore, agent-based monitoring is not an option for devices which run a proprietary embedded OS (think switch, printer, …) where you can’t install an agent in the first place.

Consequently I’ll be focusing on monitoring (event) logs with an emphasis on Microsoft Windows in this post. Having developed both agent-based as well as agent-less components in C++ over the years I feel that I am in a good position to objectively compare agent-based with agent-less approaches.

The Myths

Monitoring software is of course not the only type of software that uses agents, a lot of other enterprise software (backup, deployment, A/V …) uses agents as well. Below are some of the myths as to what (monitoring) using agents entails:

  • Agents may use up too many resources on the monitored hosts and slow down the monitored machines
  • Agents can become unstable and negatively affect the host OS
  • Deploying and managing agents is tedious and time-consuming
  • Installing agents may require the installation & deployment of dependencies the agents need (.NET, Java, …)
  • Installing third-party software will decrease the security of the monitored host

The Reality

It’s understandable that software which is installed on potentially every server and workstation in a network undergoes some level of scrutiny, but would you be surprised to learn that agents excel in the following areas:

1. Security: Better security since agents push data to a central component, instead of the monitored server being configured to allow remote collection.
2. Reliability: Agents can temporarily store and cache monitored logs if connectivity to the central monitoring server is lost, even if local logs are no longer available. Agents can also take corrective actions more quickly because they can work in isolation (offline). Mobile devices cannot be monitored with agent-less solutions since they cannot be reached by the central monitoring component.
3. Performance: Agents can apply local filtering rules and only transmit data which is valuable, thus increasing throughput while decreasing network utilization.
4. Functionality: They offer more capabilities since there are essentially no limits as to what type of information can be gathered by an agent since it has full access to the monitored system.

The Easy Way Out

Developing agents along with an easy-to-use deployment mechanism requires a lot of time and resources, so it doesn’t come as a surprise to learn that many vendors prefer to monitor hosts without agents. To compensate for the short-fall, ISV which solely have to rely on an agent-less approach will do their best to:

  • Emphasize that they do not use agents
  • Persuade you that agent-less monitoring is preferable

The irony, when promoting a solution as agent-less, is that even so-called agent-less solutions do in fact utilize and agent – the only difference being that the agent is (usually) integrated into Windows. Windows doesn’t just magically service remote clients asking for a boatload of WMI data – it processes these requests through the WMI service, which, for all intents and purposes, is an agent. For example, accessing the Windows event logs via WMI traverses significantly more layers than accessing the event logs directly.

Conclusion

With the exception of network devices where an agent cannot be installed, agent-based solutions will provide a more thorough monitoring experience 9 out of 10 times – assuming that the agent meets all the checklist requirements below.

Some event log monitoring vendors will try to convince you that agent-less monitoring is better & easier (easier for whom?) – but don’t fall for it. We’ve been tweaking and improving the EventSentry agent for more than 10 years, and as a result EventSentry offers one of the most advanced and efficient Windows agents for log monitoring on the market. Developing a rock-solid, secure and fast agent is hard, but it’s the only sensible approach which doesn’t cut corners.

There are situations when deploying a full-scale monitoring solution with agents is not possible, for example when you are tasked with monitoring a third-party network where installing any software is not an option. While unfortunate, an agent-less monitoring solution can fill the gap in this case.

EventSentry also utilizes SNMP (agent-less) to gather inventory, performance metrics as well as other system data from non-Windows devices, including Linux hosts. This collection method does suffer from the above limitations, but since log data is pushed from Non-Windows devices via the Syslog protocol, it’s an acceptable compromise.

Don’t compromise when it comes to monitoring the (event) logs of your Windows infrastructure and select an architecture which scales and offers security & performance.

Technical Comparison

The table below examines the difference between agent-based and agent-less solutions in greater detail.

Resource Utilization & Performance
Agent-Based
Agent-Less
Verdict
  • Usually higher throughput since agents can analyze, filter and evaluate log entries before sending them across the network.
  • Local resource utilization depends on the implementation of the agent.
  • Agent can access (event) logs directly via efficient API access.
  • Network utilization is likely much higher since more logs have to be transmitted across the network before being evaluated. Local filtering capabilities are limited and depend on the protocol (usually WMI).
  • Network latency and utilization affect performance of monitoring solution. Network utilization cannot be controlled.
  • Accessing (event) log data remotely through WMI is much less efficient.
  • Over-saturation of central monitoring component can negatively affect monitoring of entire infrastructure.
Higher network utilization combined with the fact that remote log collection will still utilize CPU cycles on the remote host (e.g. through WMI provider) favors agent-based solutions.
Agent-less solutions have a single point of failure, while agents can filter & evaluate data locally before transmitting them to a central database.
EventSentry Agents are designed to be essentially invisible under normal operations and do not impact the host system negatively in any way.
Stability & Reliability
Agent-Based
Agent-Less
Verdict
  • Failure of an agent does not affect monitoring of other hosts.
  • Locally collected data can be cached if central monitoring component is temporarily unavailable.
  • Failure of a central component may negatively affect deployed agents if they rely on the central component and cannot cache data.
  • Failure of central monitoring system will affect and potentially disable monitoring of all hosts.
  • Hosts which lose network connectivity (e.g. laptops) cannot be monitored while unreachable.
Agent-based solutions have an advantage since local data can be cached and corrective actions can be executed even when the central monitoring component is unavailable. Cache data & logs are re-transmitted – even if the local logs have been cleared or overwritten.
Agent-based solutions can monitor hosts even when disconnected from LAN.
The EventSentry Agent auto-recovers if the process aborts unexpectedly, and by default alerts the user when this occurs. When using the collector (default), the agent caches all data locally and retransmits when the network connection becomes available again.
Deployment
Agent-Based
Agent-Less
Verdict
  • Has to be deployed either with vendor management software and/or with third-party deployment software if vendor provides installation package (e.g. MSI).
  • Larger deployments will require multiple central monitoring components, potentially distributed over several LANs.
  • Only hosts in local LAN can be monitored.
Depends on deployment tools made available by vendor as well as management tools in place for configuring Windows settings. A poorly developed deployment tool would favor an agent-less solution.
EventSentry Agents can be deployed (multi-threaded) with the management console or through 3rd party deployment software by creating a MSI installer on the fly. When using the collector (default), agent updates (patches) can be deployed automatically.
Dependencies
Agent-Based
Agent-Less
Verdict
  • Agent may have dependencies on third-party frameworks
  • Depends on whether the mechanism utilized by the monitoring software requires a Windows component to be added and/or configured.
Depends on whether agent has dependencies and whether configuration changes need to be made on the monitored hosts.
The EventSentry Agent does not depend on any 3rd party frameworks or libraries.
Security
Agent-Based
Agent-Less
Verdict
  • Potential security issues if installed agent exposes itself to the network (if not firewalled) and/or suffers from local vulnerabilities which can be exploited.
  • Remote log collection has to be enabled and at least the central monitoring component needs to have remote access.
  • Secure data transmission relies on protocols and settings from Windows.
  • Enabling multiple methods for gathering data remotely (e.g. WMI) provides additional attack vectors.
  • Credentials (usually Windows user/password) for remote systems must be stored in a central location so that the remote hosts can be queried. If the central system gets compromised, critical credentials can be exploited.
Since agent-based solutions do not require permanent remote access and monitored hosts can therefore be hardened more, they are inherently more secure IF the agent doesn’t suffer from an insecure design and/or vulnerabilities.
Agent-based solutions also have more control over how data is transmitted from the remote hosts.
If there is general concern against third-party software then the product in question should be researched in a vulnerability database like http://www.cvedetails.com.
The EventSentry Agent does not open any ports on a monitored host and resides in a secured location on disk. The agent transmits compressed data securely via TLS to the collector. No major security vulnerabilities have been discovered in the EventSentry agent since its first release in 2002.
Scope & Functionality
Agent-Based
Agent-Less
Verdict
  • Agents have full access to the monitored system and can choose which technology to utilize to get the required data (API, WMI, registry, …)
  • Easily execute local corrective action like launching a script or process
  • Agent-less solutions are limited to remote APIs provided by the monitored host, most commonly WMI. While WMI does offer a lot of functionality, there are limitations.
  • Executing scripts on remote host is more involved and only possible when host is reachable.
Agent-based solutions have an advantage since they can utilize multiple technologies to obtain data, including highly efficient direct API access. Agents can also trigger (corrective) actions locally even while the agent is unreachable.
Agent-less solutions can only monitor data which is made available by the remote protocol.
The EventSentry Agent accesses log files, event logs and other system health data almost exclusively via direct API calls. The more resource-intensive WMI interface is only used minimally, for very specific purposes. Corrective action can be taken directly on the monitored host, often only in milliseconds after an error condition (event) has occurred.


Appendix: Checklist

When evaluating software that offers agents then you can utilize the check list below for evaluation purposes.

Resource Utilization
An agent needs to consume as little resources as possible under normal operations. With the exception of short (and unusual) peak periods, a user should never know that an agent is running on their server or workstation – period.
The thought of having a resource-hogging agent running on a server sends shivers down the backs of many SysAdmins, and the agents used by certain AntiVirus vendors that rhyme with Taffy didn’t set a good precedent.
Stability & Reliability
The agent needs to run at all times without crashing – the SysAdmin needs to be able to go to sleep knowing that his agents will reliably monitor all servers and workstations. Unstable agents are just no fun, especially when they negatively impact the host OS.
If an agent that encounters an issue, it needs to at least auto-recover and communicate the issue to the admin.
Deployment
Agent deployment and management needs to be streamlined and easy – it shouldn’t be a burden on the end user. And while agent deployment is important, agent management, keeping the remote agent up-to-date, is equally important and should – ideally – be handled automatically.
Most SysAdmins have enough work the way it is, the last thing they need is baby-sitting agents of their monitoring solution.
Dependencies
The more dependencies an agent has, the more difficult it is to deploy the agent. Agents that rely on complex frameworks like .NET, Java or specific Visual Studio runtimes are difficult and time-consuming to deploy.
Furthermore, any third-party software that is installed as a dependency creates an additional attack vector and needs to then be kept up-to-date.
Security
An agent needs to be 100% secure and cannot expose the monitored host to any additional security risks. I will explain below why using agents is actually more secure than not using an agent – even though this seems counter-intuitive at first glance.

Detecting Web Server Scans in Real-Time

Any web site exposed to the Internet is constantly being probed by bots, malicious hackers and other evildoers in an attempt to take over the machine, gain access to unauthorized data, install back doors and so forth. Detecting probing attempts as early as possible and taking corrective action as soon possible is key to maintaining a secure network.

Manual probing usually involves investigating the HTTP headers to determine the type of web server (e.g. IIS, Apache, Nginx), viewing HTML sources and possibly attempt to access well-known pages in order to determine whether any well-known web-based software (WordPress, CRM, OWA, …) is installed.

IIS Email Alert
Email alert from an IIS web site scan

If the attacker prefers the sledgehammer approach then he or she may also point a vulnerability scanner such as OpenVAS at the web server, which will reveal vulnerabilities with a minimum amount of work. Automated systems aren’t as surgical and will usually just look for specific vulnerabilities by checking for the existence of various URLs on the web server.

But whether it’s a manual probe, a vulnerability scan or a bot, all methods usually result in a non-existent page (URL) being attempted to be accessed, resulting in a “Page Not Found”, 404 error at some point. As such, a larger than usual amount of 404 errors can be a good indicator that suspicious activity is occurring on your web server. If you are a little paranoid like me then you could even look for every single 404 error that occurs on your web server. The same technique can be applied to other errors as well, such as “Access Denied” errors for example if the web site is secured by ACLs.

EventSentry’s log file monitoring feature can monitor Windows-based log files in real time and trigger alerts and/or corrective actions by applying sophisticated rulesets to all parsed text.

Log File Flow
Log File Flow (Icon made by Freepik from www.flaticon.com)

I’ll explain how this can be setup based on an IIS web server, but the same generic steps would apply to other web servers as well.

  1. Define the log file
    The first step is to tell EventSentry which log file you’d like to monitor in the management console. Using the ribbon click on “Packages”, “Log Files” and “Define Files”. In the “Log Files” section on top, click on the plus icon (+) and define the log file. Give the file a descriptive name, specify the path to the log file and select “Non-Delimited” as the file type. Make sure to utilize wild cards or variables for the log file path if the name of the log file is dynamic, as shown in the screenshot below:

    IIS Log File Setup
    IIS Log File Setup

    If you plan on storing contents in the EventSentry database as well then you can also select a matching log file definition (such as IIS 7) as the log file type. More information on log file types can be found in our IIS Log File Monitoring with EventSentry screen cast.

  2. Setup a log file filter
    A log file filter defines where content from the log file is routed to. In this example we’ll route 404 errors to the Application event log. Using the ribbon again, and while still in the log file context, click on “Add Package” on the top left to create a new package – give the package a descriptive name. Then, click the “Assign” button to assign this package globally, to a group or individual host. (remember that you can also assign packages dynamically). Now click “Add” in the “Log File” section to add the previously configured log file to the package.

    Log File Filter
    Specify how log file content is routed

    In the resulting dialog we can configure the log file filter to send log file contents to the database, the event log or both. For the purpose of this example we will only log certain lines of the log file to the event log – those matching the wildcard filter * 404* (note the space between the first * and 404) as shown in the screenshot above. You can also use a regex expression for a more sophisticated match type.

  3. Setup Event Log Filter
    At this point EventSentry will log an informational event every time the text ” 404″ is logged to the specified log file. In order to dispatch (e.g. to an email recipient) this event however, an include filter needs to be setup which should look similar to the screenshot below:

    Event Log Filter for Log File Alert
    Event Log Filter

That’s all that is required to trigger an email or process every time a 404 error is triggered on your web server. Read on to refine this setup and only get alerted when the same remote IP address triggers a certain number of 404 errors within a certain time period – fun!

Additional Resources
Owasp.org is a great resource for web developers which provides a plethora of information to help keep web sites secure. The Owasp Top 10 document illustrates what the most critical web application security flaws are.

Tutorial: Delimited Log File Monitoring
Screen Cast: Log File Monitoring with EventSentry

Bonus for Advanced Users (requires EventSentry v3.3 or later)
Getting alerts whenever specific text – like a 404 error – are logged is quite useful, but utilizing EventSentry’s advanced event log filter & thresholds features can reduce noise and make monitoring log file contents even more actionable.

EventSentry supported utilizing insertion strings from events for quite some time, allowing you to use those insertion strings either in actions (e.g. an email subject, a parameter for a script) or thresholds. Since events don’t always utilize insertion strings properly, or custom content in events needs to be parsed separately, EventSentry v3.3 and later let you define insertion strings based on regular expressions. The screenshot below shows insertion strings before and after a regular expression fitted for IIS 7.5 is applied to EventSentry’s log file monitoring alert:

Apply RegEx to Event
Overriding insertion strings by applying a regular expression

You can learn more about insertion strings here, and view insertion strings either with the Event Message Browser or the EventSentry Management Console (Tools -> Utilities). The regular expression for a default IIS 7.5 setup is as follows:

([0-9]{4}-[0-9]{2}-[0-9]{2}) ([0-9]{2}:[0-9]{2}:[0-9]{2}) ([0-9\\.]*) ([A-Z]*) (.*?) (.*?) ([0-9]*) (.*?) ([0-9\\.]*) (.*?) ([0-9]*) ([0-9]*) ([0-9]*) ([0-9]*)

Since insertion strings can be used in variables (e.g. $STR1 … $STR14) and thresholds, overriding insertion strings in an event has two main benefits:

  • Use any field from the log file in the email subject and other action fields
  • Create thresholds based on log file content – e.g. create dynamic run-time thresholds for each IP address

Regular expressions are set using the “Advanced” button on the “Generic” tab of an event log filter. In the advanced dialog, simply click “Edit” in the “Insertion String Override” section.

Using insertion strings in emails
The generic EventSentry email subject is nice, but a customized subject reflecting the type of alert would certainly be better:

Red Alert: IIS scan detected from IP $STR9

This is possible with the redefined insertion strings, since #9 (=$STR9) is the remote host’s IP address. To set a custom subject, click the “Advanced” button on the “Generic” tab of an event log filter.

Using insertion strings in thresholds
By default, threshold counters are increased every time an event matches the corresponding filter. To stick with our example here, we could configure EventSentry to let us know if more than three 404 errors occur within 5 minutes. But we’d essentially be throwing all events into the same bucket. If you look at it in detail however, you realize that it makes a difference whether three 404 errors are a result of activity from the same remote host, or three different remote hosts.

Since events are often a result of specific activity by something or somebody, it’s important that we can correlate multiple events. In our example, the “something” is the remote host, which is represented by insertion string $STR9. As such, we can configure our threshold to use $STR9 as the common identifier, and create unique thresholds based on the run-time value of $STR9. By doing that, we will trip the threshold only if the same remote host accesses a non-existing URL three times, but not if three different remote hosts only access one non-existent URL each.

Event Log Filter Threshold

The same technique can be applied to thresholds for failed logon events. It’s usually acceptable if a user types the wrong password a few times, but a large number of failed logons from the same user are not. Just applying a threshold to all 4625 events is usually not practicable since many users occasionally type a wrong password. But by tying the threshold to the insertion string representing the user name (they are 6 & 7 in case you are curious), we can create a separate threshold for every user and avoid false positives.

Defeating Ransomware with EventSentry & Auditing (Part 3/3)

There seems to be a new variant of ransomware popping up somewhere every few months (Locky being the most recent one), with every new variation targeting more users / computers / networks and circumventing protections put in place by the defenders for their previous counterparts. The whole thing has turned into a cat and mouse game, with an increasing number of software companies and SysAdmins attempting to come up with effective countermeasures.

I’ve already proposed two ways to counteract ransomware on file servers with EventSentry in part 1 and part 2, both of which take a little bit of time to implement (although I’d argue less than it would take to restore all of your files from backups). The last part of the series, remediation, offers a way to remotely log off an infected user. In this post I’m proposing a third, and better, method with the following improvements:

In the first article we configured file integrity monitoring on a volume, and if the number of file modifications occurring during a certain time interval exceeded a preset threshold, the ransomware would be stopped in its tracks. In the seconds article we used bait (canary) files to accomplish the same thing.

In this third installment we’ll keep track of the number of file modifications made by a user to detect if an infection is underway. To effectively defeat ransomware, we have to be able to distinguish between legitimate user activity and an infection. To date we know this:

  • Users add/change/remove files, but the number of changes made by a user in a short amount of time (say 15 min) is generally small
  • Ransomware always runs in the context of a user, and as such an infection will usually come from one user (unless things go really awry and multiple users are infected). The approach here will work equally well, regardless of the number of infections.

Thus, to detect an infection, EventSentry will be counting the number of file modifications (event 4663) with its advanced threshold capabilities. If the threshold is exceeded, EventSentry will trigger an action of your choice (e.g. disable the user, remove a file share, stop the server service, …) to limit the damage of the ransomware.

Here is what you need:

  • Object Access / File System Auditing enabled
  • Auditing enabled on the files which are to be protected
  • EventSentry installed on the server which needs to be protected

This  KB article explains how to configure EventSentry and enable auditing (preferably through group policy) on one or more directories. I recommend referencing the KB article when you’re ready to configure everything. Pretty much everything in the KB article applies here, although we will make a small change to the threshold settings of the filter (last paragraph of section (4)).

Windows Folder Auditing

Once auditing is setup, Windows will log event 4663 for every write access which is performed by a user. An example event looks like this:

Windows Event 4663
Windows Event 4663

The default behavior of a filter threshold in EventSentry is to simply count every filter match towards the threshold. In our case, every 4663 event encountered would count towards the threshold. You can think of there being one bucket for all 4663 events, with the bucket being emptied whenever the threshold period expires, say every 5 minutes. If the bucket fills up we can trigger an alert.

This doesn’t work so well on a file server, where potentially hundreds of users are constantly modifying files. It would take some time to come up with a good baseline (how many file modifications are considered “normal”) that we could use as a threshold, and there would still be a chance for a false positive. For example, a lot of 4663 events could be generated during a busy day at the office, thus causing the threshold to reach its limit.

A better way is to assign each user their own “personal” threshold which we can then monitor. Think of it like each user having their own bucket. If a user writes to a file, EventSentry adds the 4663 event only to that user’s bucket. Subsequently, an alert is only triggered when a user’s bucket is full. Any insertion string of an event can be used to create a new bucket.

We can do this by utilizing the insertion string capabilities of the filter threshold feature. Setting this up is surprisingly easy – all we have to do is change the Threshold Options to “Event”, click the “Insertion Strings” button and select the correct insertion string. What is the correct insertion string? The short answer is #1.

The long answer lies in the “Event Message Browser”, which you can either find through the Tools – Utilities menu in the EventSentry Management Console or in the EventSentry SysAdmin Tools. Once in there, click on “Security”, then “Microsoft-Windows-Security-Auditing”, then 4663. You will see that the number next to the field identifying the calling user (“Security ID”) is %1.

Event 4663 Definition

Enough with the theory, here is what you need to implement it (assuming EventSentry is already installed on the servers hosting the file share(s)):

  1. Enable global auditing globally and audit the file share(s). See section 2 & 3 of KB 279.
  2. Determine what action you want to take when a ransomware infection has been detected. See either section 1 of KB 279 or “Dive! Stopping the Server Service” from the previous blog post.
  3. Create a package & filter looking for 4663 events. See section 4 of KB 279 and review the additional threshold settings below.

Customizing the threshold
Once you have the package & threshold filter for 4663 events in place, we need to modify the threshold settings as explained above. Edit the filter, click the threshold tab and make sure your filter looks like the one shown below:

Threshold Settings
Threshold Settings

The only variable setting is the actual threshold, since it depends on how fast the particular variant of ransomware would be modifying files. A couple of things to keep in mind:

  • The interval shouldn’t be too long, otherwise it will take too long before the infection is detected.
  • Make sure the actual event log filter is only looking at 4663 events, no other event ids.

With the above example, any user modifying any file (on a given server) more than 30 times in 3 minutes will trigger any action associated with the filter, e.g. shutting down the server service. Note that the action listed in the General tab will be triggered as soon as the threshold is met. If 30 4663 events for a single user are generated within 45 seconds, the action will be triggered after 45 seconds, it won’t wait 3 minutes.

Bonus – Disabling a user
One advantage of intercepting 4663 events is that we can extract information from them and pass them to commands. While shutting down the Server service is pretty much essential, there are a few other things you can do once you have data from the events, e.g. the username, available. You can now do things like:

  • Disabling the user
  • Removing the user from the share permissions
  • Revoking access to select folders for the user

There are a couple of caveats when (trying to) disable a user however:

  1. The user account (usually the computer account) under which the EventSentry service runs under (usually LocalSystem) needs to be part of the Account Operators group so that it has permission to disable a user
  2. Disabling a user is usually not enough though, since Windows won’t automatically disconnect the user or revoke access. As such, any ransom/crypto process already running will continue to run – even if the user has been disabled.

Disabling a user account from the command line is surprisingly simple (leave Powershell in the drawer). To disable the user john.doe, simply run this command:

net user john.doe /domain /active:no

Note that since “net user” doesn’t support a domain prefix (MYDOMAIN\john.doe won’t work), we need to make sure that we pass only the username (which is insertion string %2) and the /domain switch to ensure the user is disabled on the domain controller. Of course you would need to omit the /domain switch if the users connecting to the share are local users. The action itself would look like the screenshot below, where $STR2 will be substituted by EventSentry with the actual user listed in the event 4663:

Action to disable a user

That’s it, now just push the configuration and you should be much better prepared to take any ransomware attacks heading your users way.

Oh, and check those backups, would you?

Automatically restarting services or processes based on resource usage

In the ideal world, every software we install on our servers and workstations uses as few resources as possible, doesn’t have memory or handle leaks and never crashes.

But in reality, Sysadmins often have to deal with temperamental business-critical third-party applications (or in-house developed) which exhibit a number of issues, including:

  • Memory Leak: The application keeps eating away at the available memory like a chubby caterpillar chewing on a leaf
  • Handle Leak: The application continuously increases its handle count, which takes away from kernel memory over time
  • CPU Spike: The application uses all CPU time of one or more cores

When one of these issues is encountered, a manual application (or service) restart, along with a potential bug report, is usually the only solution. Consequently, keeping a close eye on both Windows and third-party software – especially on servers – is considered good practice. But even better than looking is being proactive of course, for example by automatically restarting a service which uses too much memory or CPU.

Frozen Leak

This is where EventSentry comes in. EventSentry doesn’t just analyze metrics available through Windows performance counters (e.g. CPU usage, handle or memory count of a process.), it also allows you to take corrective action based on granular rule sets. This ensures that all active applications are behaving nicely by staying within pre-defined performance boundaries.

To get there, we utilize 3 features in EventSentry:

1. Performance Monitoring
2. Event Log monitoring
3. Service restart or process action

Since examples usually work best, I will outline the steps required to restart the printer spooler service if it uses more than 100 Mb of RAM. This is for illustration purposes only, I’m not suggesting that the printer spooler service should not use more than 100 Mb of RAM.

Performance Monitoring
Application performance monitoring is already setup out-of-the-box via the “Performance Applications” System Health package. This package, by default, is assigned to all hosts and collects key application metrics in the EventSentry database. Since this package is generic and captures all processes (without generating alerts), we’ll create a separate package that will only monitor the spooler service.

Unless you resort to scripting, it is unfortunately not easily possible to automatically link process names (as they are reported by the Windows performance monitoring subsystem) to a service name. As such, we will need to first find out the process of the service we are monitoring and then monitor only that instance of the performance counter. To determine the process for a given service, simply view the properties of the services in the “Services” or “View local services” application and look for the “Path to executable” field. New versions of Windows also show a list of all services in task manager and let you jump to the process by clicking on “Go to details”. The name of the instance is the process name without the .exe extension, spoolsv in this case.

The next step is to create a new System Health package and add a performance object. Select the System Health packages container, click “Add package” from the ribbon and enter a suitable name. Select the newly created package and add the performance object to the package. Now select the “Performance” object and click the “+” icon to add a new performance object to monitor. Every performance object in EventSentry requires at least a name (to describe the counter) as well as the actual Windows performance counter. The respective performance counter for monitoring the memory usage of a process is Process(*)\Working Set, and since we are only interested in the spooler process we will use of the Process(spoolsv)\Working Set performance counter. When you are done, the dialog should look similar to what is shown below:

Performance Counter Setup
Specifying the performance counter to monitor the memory usage of the spooler process

The default frequency is 10 seconds which works well for most counters, but you can increase this frequency for counters which change only minimally over the short term (as is usually the case for memory usage and handle count), so we will use 30 seconds in this case.

Now that we are successfully tracking the memory usage of the spooler service, we need to setup a hard limit in order to get an event when that limit is exceeded. Click on the “Alert” tab and configure the dialog as shown below:

Specifying the alert limit for the performance counter

We are only concerned with the top section of the dialog, please see the documentation for more details on the “Notify at most …” and below options.

The last step in this section is to assign the package: Select the package, click “Assign” in the ribbon and assign the package to a computer or group. EventSentry is now tracking the memory usage of the spoolsv process and will log a warning event if the memory usage exceeds 100 Mb.

Action
EventSentry uses actions to send emails, toggle services or start processes. Since we want to restart the spooler service, we’ll create a Service action. Select the “Actions” container and click the “Add” button. Select the “Service” action type and assign it a descriptive name, e.g. “Restart Print Spooler Service”.

The configuration of this action is probably the most simple in this tutorial – just specify the service name and the desired action as shown below:

Specifying the service to be restarted

Connecting the dots: Event Log Filter
We’re monitoring the memory usage of the spooler now and have an action which can restart the spooler service, but how do we connect the two? You probably guessed it – with an event log filter. Event Log filters allow you to connect an event (e.g. memory usage is too high) with an action (e.g. restart spooler service).

We’ll create an event log filter which will look for the exact event that is being logged when the memory usage of our performance counter exceeds 100 Mb, and trigger the service restart action.

Similar to what we did with the system health package, right-click the “Event Log Packages” container (or use the ribbon) to create a new event log package and assign it to the computer(s) and or group(s) in question.

Then, add a new INCLUDE filter to the package. Alternatively you can also click the “Alerts” button while the performance object is selected to go through a wizard. Either way, the filter should look like the screenshot below:

Specifying the event properties which will trigger the service restart action

Now, when the performance monitor writes event id 12104 with the above properties, EventSentry will trigger the “Restart Print Spooler Service” action which should reset the memory usage of the process. As an added bonus, an email is also fired off so that the operator knows that EventSentry took the corrective action.

Note: Don’t forget to push the configuration to any remote hosts if necessary.

Now sit back and relax knowing that another thing is taken care of for you.