This latest update to EventSentry improves your security posture with validation scripts, simplifies IT troubleshooting for both administrators and users, gives you visibility into installed browser extensions along with many other usability improvements in the web reports.
Validation Scripts
Proactively identifying (potentially) malicious behavior is the cornerstone of any security defense, and a key feature of log management / SIEM solutions. But many security violations are the direct consequence of incorrect or missing settings on endpoints.
Traditional log management solutions may show you when something is happening that shouldn’t be happening, yes. But wouldn’t it be better to assess key OS components and security settings on a regular basis, and identify known weaknesses?
Consider a motion-triggered camera that will let you know when somebody is snooping around your property at 3AM in the morning. That camera is extremely important, and the foundation of any serious property security system – without it, you wouldn’t even know what was going on!
But wouldn’t it be even better if somebody was inspecting your windows, fence and locks on a regular basis, to let you know if a door or window was unlocked, or an insecure lock was being used at one of the entrances? If your overall perimeter was more secure in the first place, there would be fewer potential intrusion attempts.
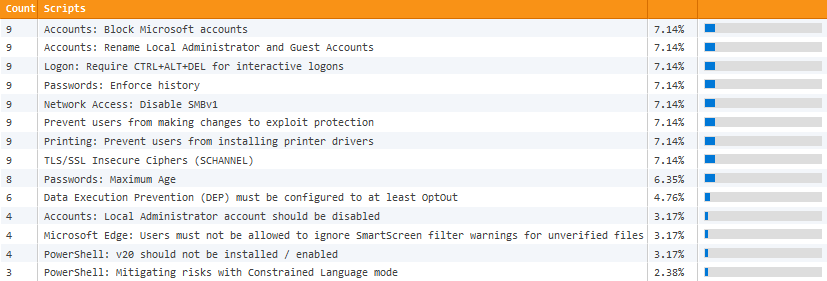
And that’s exactly what EventSentry’s 60+ validation scripts do. Our managed security & health checks continuously compare critical settings on your monitored hosts with our baseline, immediately indicating potential risks. These checks identify a wide variety of potential risks, such as:
- A Windows server/workstation is not on the latest patch
- Windows firewall is disabled
- No A/V software installed
- Insecure TLS protocols are enabled
- Microsoft accounts aren’t blocked
EventSentry already includes a number of features that help detect security violations, rogue network devices, unauthorized software, suspicious network activity and more. But by utilizing the new validation scripts, you can fix many problems at the source – before they show symptoms.
The scripts are managed by NETIKUS.NET, updated regularly, and can be downloaded through the management console with a single click. Validation scripts are also tagged with keywords such as #server #compliance #stig-high-server to make sure that only relevant checks are assigned.
Which Browser Extensions are lurking in your network?
While web browser extensions can boost productivity and excite your end users, they also have inherent privacy and security risks. All major web browsers let users install as many extensions as they wish by default – without restrictions!
But do you actually know how many Firefox, Chrome or Edge extensions are installed on browsers across your IT infrastructure?
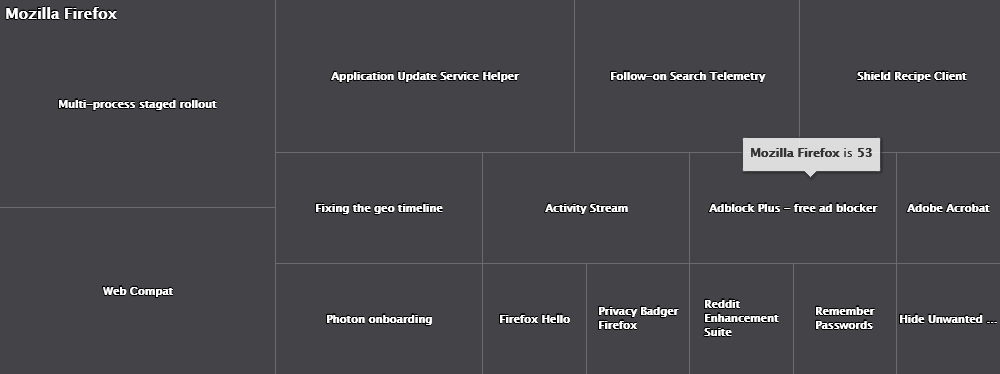
As an “extension” (no pun intended) of EventSentry’s software monitoring component, all browser extensions of Mozilla Firefox, Google Chrome and Microsoft Edge (Chromium-based) are inventoried with support for:
- Alerts (extensions are installed/updated/uninstalled)
- Searchable inventory
With this information at the fingertips, an initial discovery can be performed, a baseline set and reports or alerts can be received on a regular basis showing new extensions being installed.
Troubleshoot, Document & Support End Users with “EventSentray”
Supporting your end users has probably never been more challenging, considering they’re distributed all across the place and not conveniently squeezed into an office building anymore.
With the tray app “EventSentray”, your end users can submit support tickets to many common ticketing systems via email or HTTP requests right from the tray with a customizable link. And the best part? Support tickets created by the app not only include pertinent system information (current CPU %, host name, uptime, …) but can also include a current screenshot.
But we didn’t just design the tray app to give end users a way to submit support tickets right from their desktop, but also to help sysadmins.
Let’s be honest, when we log on to a server then it’s often because something isn’t working the way it should. Wouldn’t it be nice if one had easy access to information like:
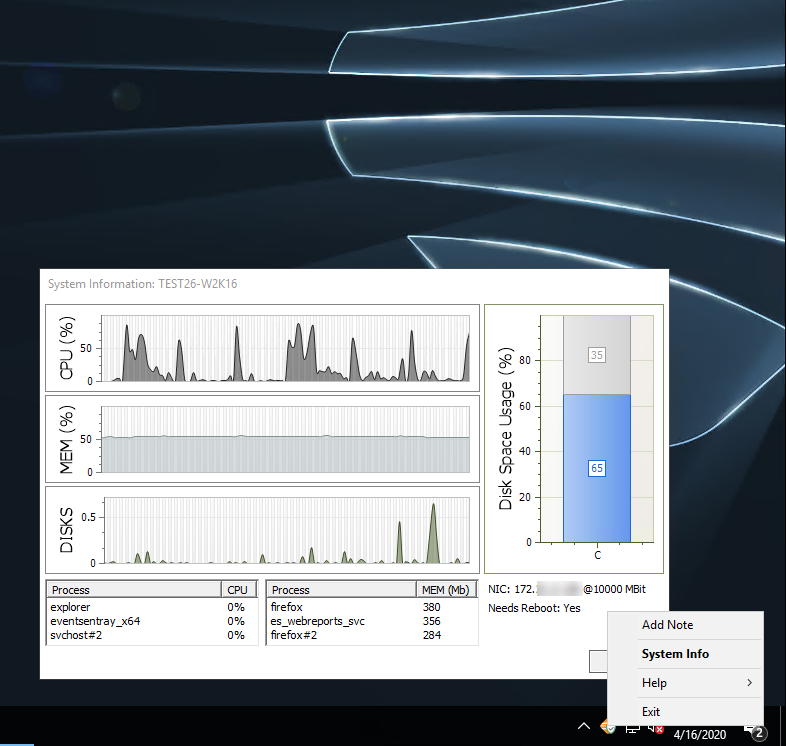
- CPU, Memory, Disk Usage & Utilization
- Top 3 apps consuming CPU and memory
- IP address, host name and connection speed
- Whether the host needs a reboot
Simply double-clicking the EventSentry icon and the System Information dialog will show all of the above information – and more. Hovering over the charts will reveal additional hardware information as well.
And for those working in teams with shared responsibilities, right-clicking the tray app also lets you add notes (including a screenshot) for the monitored host. Those notes are then visible in the web reports and ensure that everyone on your team is on the same page when you make significant changes to a server or workstation. Documentation is key!
Tracking Administrator Activity
Many compliance frameworks require that you track activity by Administrators (e.g. Domain Admins) on your network. ADMonitor users now have the ability to filter all compliance reports (e.g. Logon Activity, Process Activity) to only show activity from users with domain admin privileges.
Dashboard Import / Export
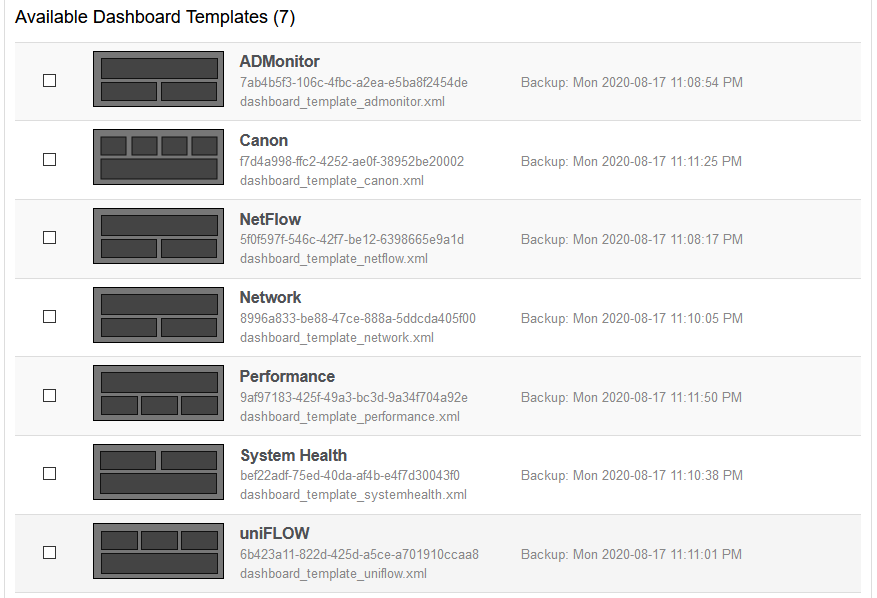
To make setting up dashboards easier and faster, EventSentry now ships with a number of dashboard templates that you can import. You can also export your own dashboards and import them on another EventSentry installation.
Webcam & Image Dashboard Tiles
The latest edition of the web reports includes a number of dashboard improvements, but the new image / webcam tile type definitely sticks out.
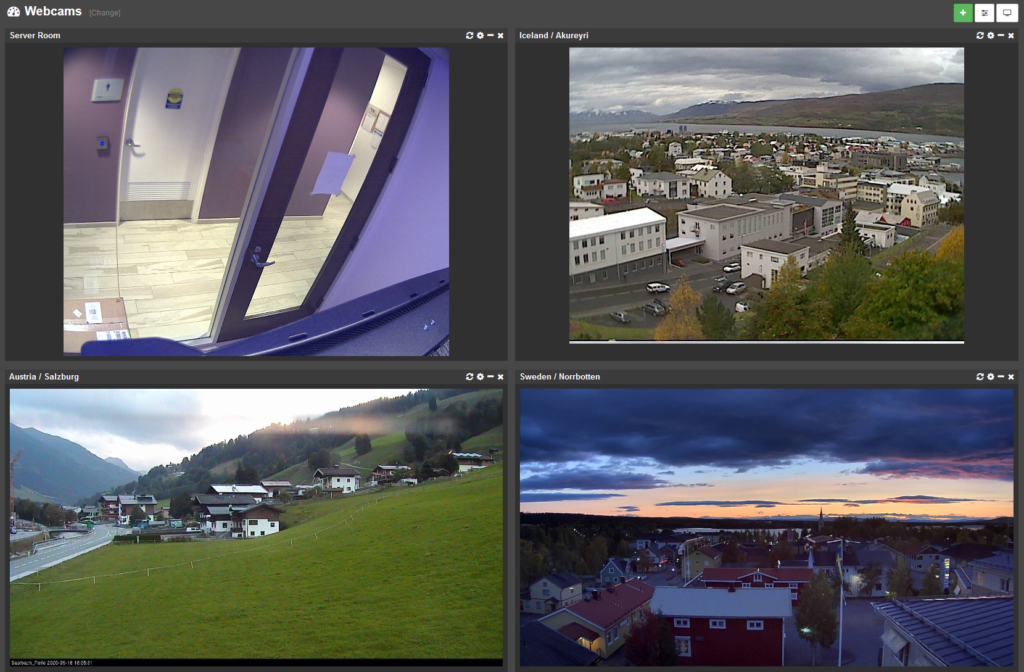
With the new “Image” tile you can point the web reports to a static image or stream to be displayed on any dashboard!