Additional Notes on EventSentry Update v3.2.1.30

Our latest patch for EventSentry v3.2 (v3.2.1.30) requires some additional information in addition to the release notes.

Heartbeat Monitoring (Agent Status)
By default, the EventSentry Heartbeat Monitor ensures that all remote agents are running by querying the status of the remote “EventSentry” service. While is an accurate way to ensure the remote agent is running, the Microsoft RPC mechanism isn’t very efficient when connecting to remote hosts across a slow (WAN) link, and concurrently checking the service status of 100+ hosts at the same time can on occasion also cause issues. In these situations, the heartbeat agent may not be able to monitor all hosts in the configured monitoring interval. Furthermore, querying the remote status of a service requires that the EventSentry Heartbeat Agent run under a domain account, otherwise the dreaded “Access Denied” error appears on the heartbeat status page in the web reports.

To address these issues for larger EventSentry deployments (500+ hosts) and deployments where the remote agents are connected through a slower WAN link, we have added the ability to query the remote agent status through the EventSentry database where the remote agents periodically check in. This check is enabled by default for new installations, but existing installations will need to make a database permission change in order to give the heartbeat agent permission to query the agent status. More information can be found here.

In the next release of EventSentry (v3.3), this functionality will be configurable, and the heartbeat agent will also be able to determine the current agent status by communicating directly with the collector service (when enabled) for even better accuracy. The Heartbeat Monitor will always attempt to revert back to the legacy method of checking the service status directly if it cannot obtain the status through other means.

Service Monitoring: Configuration Changes
EventSentry distinguishes between three types of service changes: Status changes (e.g. Running to Stopped), service configuration changes (e.g. changes to the startup type) and services being added or removed. Up until release 3.2.1.22, all status changes and service configuration changes were logged with the same event severity, which we didn’t think was very fitting since the status change of a service is very different to a change of the service itself. As such, starting with 3.2.1.30, only service status changes will be logged under the severity configured under “Monitor Service Status Changes” category. All other service changes will be logged under the severity configured under “Monitor Service Addition / Removal” category.

Management Console: Quicktools
The EventSentry QuickTools allow you to run an application/script against a server or workstation in your EventSentry configuration. EventSentry includes a few default QuickTools entries, such as “Reboot”, “Remote Desktop” and others. Starting with the latest release we added a new “Hide” option, which will not show the executed application on the desktop. This will be useful for integrating our upcoming VNC wrapper scripts (Blog article coming soon), which will allow you to install & launch a (Tiger)VNC client directly from the EventSentry management console.

EventSentry Light 3.2
Starting with this release, EventSentry Light v3.2 will also be available. We have good news for all EventSentry Light users: We have increased the number of full hosts you can remotely manage to 5, and also increased the number of network devices you can monitor to 5. As such you can now monitor up to 10 hosts with EventSentry Light completely for free.

Defeating Ransomware with EventSentry & Auditing (Part 3/3)

There seems to be a new variant of ransomware popping up somewhere every few months (Locky being the most recent one), with every new variation targeting more users / computers / networks and circumventing protections put in place by the defenders for their previous counterparts. The whole thing has turned into a cat and mouse game, with an increasing number of software companies and SysAdmins attempting to come up with effective countermeasures.

I’ve already proposed two ways to counteract ransomware on file servers with EventSentry in part 1 and part 2, both of which take a little bit of time to implement (although I’d argue less than it would take to restore all of your files from backups). The last part of the series, remediation, offers a way to remotely log off an infected user. In this post I’m proposing a third, and better, method with the following improvements:

In the first article we configured file integrity monitoring on a volume, and if the number of file modifications occurring during a certain time interval exceeded a preset threshold, the ransomware would be stopped in its tracks. In the seconds article we used bait (canary) files to accomplish the same thing.

In this third installment we’ll keep track of the number of file modifications made by a user to detect if an infection is underway. To effectively defeat ransomware, we have to be able to distinguish between legitimate user activity and an infection. To date we know this:

  • Users add/change/remove files, but the number of changes made by a user in a short amount of time (say 15 min) is generally small
  • Ransomware always runs in the context of a user, and as such an infection will usually come from one user (unless things go really awry and multiple users are infected). The approach here will work equally well, regardless of the number of infections.

Thus, to detect an infection, EventSentry will be counting the number of file modifications (event 4663) with its advanced threshold capabilities. If the threshold is exceeded, EventSentry will trigger an action of your choice (e.g. disable the user, remove a file share, stop the server service, …) to limit the damage of the ransomware.

Here is what you need:

  • Object Access / File System Auditing enabled
  • Auditing enabled on the files which are to be protected
  • EventSentry installed on the server which needs to be protected

This  KB article explains how to configure EventSentry and enable auditing (preferably through group policy) on one or more directories. I recommend referencing the KB article when you’re ready to configure everything. Pretty much everything in the KB article applies here, although we will make a small change to the threshold settings of the filter (last paragraph of section (4)).

Windows Folder Auditing

Once auditing is setup, Windows will log event 4663 for every write access which is performed by a user. An example event looks like this:

Windows Event 4663
Windows Event 4663

The default behavior of a filter threshold in EventSentry is to simply count every filter match towards the threshold. In our case, every 4663 event encountered would count towards the threshold. You can think of there being one bucket for all 4663 events, with the bucket being emptied whenever the threshold period expires, say every 5 minutes. If the bucket fills up we can trigger an alert.

This doesn’t work so well on a file server, where potentially hundreds of users are constantly modifying files. It would take some time to come up with a good baseline (how many file modifications are considered “normal”) that we could use as a threshold, and there would still be a chance for a false positive. For example, a lot of 4663 events could be generated during a busy day at the office, thus causing the threshold to reach its limit.

A better way is to assign each user their own “personal” threshold which we can then monitor. Think of it like each user having their own bucket. If a user writes to a file, EventSentry adds the 4663 event only to that user’s bucket. Subsequently, an alert is only triggered when a user’s bucket is full. Any insertion string of an event can be used to create a new bucket.

We can do this by utilizing the insertion string capabilities of the filter threshold feature. Setting this up is surprisingly easy – all we have to do is change the Threshold Options to “Event”, click the “Insertion Strings” button and select the correct insertion string. What is the correct insertion string? The short answer is #1.

The long answer lies in the “Event Message Browser”, which you can either find through the Tools – Utilities menu in the EventSentry Management Console or in the EventSentry SysAdmin Tools. Once in there, click on “Security”, then “Microsoft-Windows-Security-Auditing”, then 4663. You will see that the number next to the field identifying the calling user (“Security ID”) is %1.

Event 4663 Definition

Enough with the theory, here is what you need to implement it (assuming EventSentry is already installed on the servers hosting the file share(s)):

  1. Enable global auditing globally and audit the file share(s). See section 2 & 3 of KB 279.
  2. Determine what action you want to take when a ransomware infection has been detected. See either section 1 of KB 279 or “Dive! Stopping the Server Service” from the previous blog post.
  3. Create a package & filter looking for 4663 events. See section 4 of KB 279 and review the additional threshold settings below.

Customizing the threshold
Once you have the package & threshold filter for 4663 events in place, we need to modify the threshold settings as explained above. Edit the filter, click the threshold tab and make sure your filter looks like the one shown below:

Threshold Settings
Threshold Settings

The only variable setting is the actual threshold, since it depends on how fast the particular variant of ransomware would be modifying files. A couple of things to keep in mind:

  • The interval shouldn’t be too long, otherwise it will take too long before the infection is detected.
  • Make sure the actual event log filter is only looking at 4663 events, no other event ids.

With the above example, any user modifying any file (on a given server) more than 30 times in 3 minutes will trigger any action associated with the filter, e.g. shutting down the server service. Note that the action listed in the General tab will be triggered as soon as the threshold is met. If 30 4663 events for a single user are generated within 45 seconds, the action will be triggered after 45 seconds, it won’t wait 3 minutes.

Bonus – Disabling a user
One advantage of intercepting 4663 events is that we can extract information from them and pass them to commands. While shutting down the Server service is pretty much essential, there are a few other things you can do once you have data from the events, e.g. the username, available. You can now do things like:

  • Disabling the user
  • Removing the user from the share permissions
  • Revoking access to select folders for the user

There are a couple of caveats when (trying to) disable a user however:

  1. The user account (usually the computer account) under which the EventSentry service runs under (usually LocalSystem) needs to be part of the Account Operators group so that it has permission to disable a user
  2. Disabling a user is usually not enough though, since Windows won’t automatically disconnect the user or revoke access. As such, any ransom/crypto process already running will continue to run – even if the user has been disabled.

Disabling a user account from the command line is surprisingly simple (leave Powershell in the drawer). To disable the user john.doe, simply run this command:

net user john.doe /domain /active:no

Note that since “net user” doesn’t support a domain prefix (MYDOMAIN\john.doe won’t work), we need to make sure that we pass only the username (which is insertion string %2) and the /domain switch to ensure the user is disabled on the domain controller. Of course you would need to omit the /domain switch if the users connecting to the share are local users. The action itself would look like the screenshot below, where $STR2 will be substituted by EventSentry with the actual user listed in the event 4663:

Action to disable a user

That’s it, now just push the configuration and you should be much better prepared to take any ransomware attacks heading your users way.

Oh, and check those backups, would you?

Automatically restarting services or processes based on resource usage

In the ideal world, every software we install on our servers and workstations uses as few resources as possible, doesn’t have memory or handle leaks and never crashes.

But in reality, Sysadmins often have to deal with temperamental business-critical third-party applications (or in-house developed) which exhibit a number of issues, including:

  • Memory Leak: The application keeps eating away at the available memory like a chubby caterpillar chewing on a leaf
  • Handle Leak: The application continuously increases its handle count, which takes away from kernel memory over time
  • CPU Spike: The application uses all CPU time of one or more cores

When one of these issues is encountered, a manual application (or service) restart, along with a potential bug report, is usually the only solution. Consequently, keeping a close eye on both Windows and third-party software – especially on servers – is considered good practice. But even better than looking is being proactive of course, for example by automatically restarting a service which uses too much memory or CPU.

Frozen Leak

This is where EventSentry comes in. EventSentry doesn’t just analyze metrics available through Windows performance counters (e.g. CPU usage, handle or memory count of a process.), it also allows you to take corrective action based on granular rule sets. This ensures that all active applications are behaving nicely by staying within pre-defined performance boundaries.

To get there, we utilize 3 features in EventSentry:

1. Performance Monitoring
2. Event Log monitoring
3. Service restart or process action

Since examples usually work best, I will outline the steps required to restart the printer spooler service if it uses more than 100 Mb of RAM. This is for illustration purposes only, I’m not suggesting that the printer spooler service should not use more than 100 Mb of RAM.

Performance Monitoring
Application performance monitoring is already setup out-of-the-box via the “Performance Applications” System Health package. This package, by default, is assigned to all hosts and collects key application metrics in the EventSentry database. Since this package is generic and captures all processes (without generating alerts), we’ll create a separate package that will only monitor the spooler service.

Unless you resort to scripting, it is unfortunately not easily possible to automatically link process names (as they are reported by the Windows performance monitoring subsystem) to a service name. As such, we will need to first find out the process of the service we are monitoring and then monitor only that instance of the performance counter. To determine the process for a given service, simply view the properties of the services in the “Services” or “View local services” application and look for the “Path to executable” field. New versions of Windows also show a list of all services in task manager and let you jump to the process by clicking on “Go to details”. The name of the instance is the process name without the .exe extension, spoolsv in this case.

The next step is to create a new System Health package and add a performance object. Select the System Health packages container, click “Add package” from the ribbon and enter a suitable name. Select the newly created package and add the performance object to the package. Now select the “Performance” object and click the “+” icon to add a new performance object to monitor. Every performance object in EventSentry requires at least a name (to describe the counter) as well as the actual Windows performance counter. The respective performance counter for monitoring the memory usage of a process is Process(*)\Working Set, and since we are only interested in the spooler process we will use of the Process(spoolsv)\Working Set performance counter. When you are done, the dialog should look similar to what is shown below:

Performance Counter Setup
Specifying the performance counter to monitor the memory usage of the spooler process

The default frequency is 10 seconds which works well for most counters, but you can increase this frequency for counters which change only minimally over the short term (as is usually the case for memory usage and handle count), so we will use 30 seconds in this case.

Now that we are successfully tracking the memory usage of the spooler service, we need to setup a hard limit in order to get an event when that limit is exceeded. Click on the “Alert” tab and configure the dialog as shown below:

Specifying the alert limit for the performance counter

We are only concerned with the top section of the dialog, please see the documentation for more details on the “Notify at most …” and below options.

The last step in this section is to assign the package: Select the package, click “Assign” in the ribbon and assign the package to a computer or group. EventSentry is now tracking the memory usage of the spoolsv process and will log a warning event if the memory usage exceeds 100 Mb.

Action
EventSentry uses actions to send emails, toggle services or start processes. Since we want to restart the spooler service, we’ll create a Service action. Select the “Actions” container and click the “Add” button. Select the “Service” action type and assign it a descriptive name, e.g. “Restart Print Spooler Service”.

The configuration of this action is probably the most simple in this tutorial – just specify the service name and the desired action as shown below:

Specifying the service to be restarted

Connecting the dots: Event Log Filter
We’re monitoring the memory usage of the spooler now and have an action which can restart the spooler service, but how do we connect the two? You probably guessed it – with an event log filter. Event Log filters allow you to connect an event (e.g. memory usage is too high) with an action (e.g. restart spooler service).

We’ll create an event log filter which will look for the exact event that is being logged when the memory usage of our performance counter exceeds 100 Mb, and trigger the service restart action.

Similar to what we did with the system health package, right-click the “Event Log Packages” container (or use the ribbon) to create a new event log package and assign it to the computer(s) and or group(s) in question.

Then, add a new INCLUDE filter to the package. Alternatively you can also click the “Alerts” button while the performance object is selected to go through a wizard. Either way, the filter should look like the screenshot below:

Specifying the event properties which will trigger the service restart action

Now, when the performance monitor writes event id 12104 with the above properties, EventSentry will trigger the “Restart Print Spooler Service” action which should reset the memory usage of the process. As an added bonus, an email is also fired off so that the operator knows that EventSentry took the corrective action.

Note: Don’t forget to push the configuration to any remote hosts if necessary.

Now sit back and relax knowing that another thing is taken care of for you.

EventSentry SysAdmin Tools: New SNMP query utility “snmptool”

I’m excited to announce a new version of our free EventSentry SysAdmin Tools which, in addition to bug fixes and minor improvements, also includes a new command-line tool: snmptool. This brings the total number of utilities in the toolkit to thirty (30)!

Free SNMP tools for Windows® are not easy to find and often require you to memorize the various OIDs in order to test a remote host’s SNMP functionality, or to get useful information back.

Our free snmptool utility solves that problem by giving you a simple utility which downloads a variety of stats, depending on what the remote host provides via SNMP, and displays it to the user. For example, if you are querying a VMWare® ESXi™ host with the snmptool, it will – among other stats – enumerate all VMs configure on the host, whereas it will display switch port mappings when querying a switch.

The snmptool currently retrieves the following:

  • System Description string
  • Operating System
  • Uptime
  • Current CPU usage
  • Network interfaces (name, MAC address, IP if available)
  • Mounted disks
  • Running processes
  • Virtual Machines (ESXi™ only)
  • Switch port mappings

Running the utility is incredibly easy, simply specify the SNMP credentials and the remote host, and the utility will do the rest on its own:

C:\>snmptool /u public linuxserver
System Description: Linux openvas.netikus.local 4.32.22-573.7.1.el6.x86_128 #1 SMP Tue Sep 22 22:00:00 UTC 2019 x86_128
OS Info:            Linux 4.32.22-573.7.1.el6.x86_128 #1
Current Uptime:     3 years, 321 days, 3 hours and 52 minutes
CPU Usage:          0%
NICS:
=====
01: eth0 00-80-73-C3-57-BF (122.111.7.14)
DISKS:
======
01: DISK / (13892 Mb, 67% free)
02: DISK /dev/shm (938 Mb, 100% free)
03: DISK /boot (476 Mb, 75% free)
PROCESSES:
==========
01: init, PID=1
02: watchdog/1, PID=10
03: ext4-dio-unwrit, PID=1000
04: kauditd, PID=1035
05: migration/2, PID=11
06: flush-253:0, PID=1129
07: stopper/2, PID=12
08: kdmremove, PID=129
09: ksoftirqd/2, PID=13
10: kstriped, PID=130
….
125: kthrotld/3, PID=91
126: pciehpd, PID=92
127: kpsmoused, PID=94
128: usbhid_resumer, PID=95
129: deferwq, PID=96
130: jbd2/sda1-8, PID=999

The output is completely dynamic, if no processes are found (e.g. you are querying a switch) then that section will simply be omitted.

In addition to the brand new snmptool, version 2.2.0.1 of the EventSentry SysAdmin Tools includes the following other improvements:

Purgetemp
Added the new /a parameter which checks the target folder against a pattern for additional safety

Checkurl
Added support for authenticating against a login page, including login pages which redirect

I hope the new utility and other improvements will help make your job easier. Oh, and you can download the EventSentry SysAdmin Tools here.


Trapping CryptoLocker/CryptoWall with Honey (Part 2/3)


! Updates !
There has been a follow-up post to this article with even better approaches to defeating ransomware. I highly recommend that you jump directly to the most recent article which offers the best & easiest approach for protecting against Ransomware:

Defeating Ransomware with EventSentry & Auditing (Part 3)


When I wrote my first, original post about CryptoLocker (“CryptoLocker Defense for Sysadmins”), I didn’t intend there to be a part 2 or even a part 3. But alas, due to the “popularity” of CryptoLocker and the recent release of CryptoWall 4.0 I decided to write a much-needed sequel to my first blog post. Part #2 differs from the first part with a different (and more simple) detection “algorithm” combined with a more reliable way to stop the “Server” service when CryptoLocker is indeed detected.

The capitol of São Tomé and PríncipeSurprisingly (or not surprisingly), almost 2 years after I wrote my first article, CryptoLocker and its descendants like CryptoWall are still around, thriving, and keeping Sysadmins around the world busy. A recent report stated that CryptoWall 3.0 cost victims a combined $325 million, although it fails to mention whether this is an annual or lifetime figure. This is the same as the GDP of the small African country of São Tomé and Príncipe (population of about 200,000) in 2014.

Now there is something to think about – the criminals behind the various ransomware software collected as much money as a country with 200,000 people. Alright, this is all very interesting but doesn’t help us protect ourselves from ransomware so let’s focus.

In part #1 we used EventSentry’s file monitoring feature to index and inventory all files on a susceptible file share, a very accurate and resilient way to detect any sort of software which would modify large numbers of files in a short time period. While this approach works well, it does require more time to setup and may not work in real-time when monitoring extremely large directories. Consequently we’ll be using a different approach here, and we will look at yet another approach in part #3.

EventSentry’s file checksum monitoring feature was originally intended to monitor only key Operating System folders such as the System32 directory, but increased customer demand prompted us to tweak the feature over time to allow real-time monitoring of even very large folders (as is the case for file servers) as well. But enough of the past, let’s tackle Crypto*.

What’s New?
New versions of software (especially free) are usually exciting, but I’m guessing that the latest “improvements” rolled into the various types of ransomware, including CryptoWall, are only exciting for security researches and the people behind the ransomware. There are three major new features included (for free) in the latest version of CryptoWall:

  • Files are not only encrypted, but file names are now also mangled, making it almost impossible to link the encrypted file(s) with their originals.
  • Shadow copies are being deleted if possible, so that past versions of files are no longer accessible
  • The encryption process seems to be less linear and less complete, resulting in some folders being left alone and thus making detection more difficult.

HoneyThe Theory
If you’ve been working in the IT (security) field for a while then you’ll have probably heard of honeypots before. Honeypots are usually systems emulating a production server with the purpose of detecting an attacker and potentially triggering counter-measures or alerts.

We’ll apply the concept of honeypots to detect CryptoLocker, but instead of emulating entire systems we’ll plant on or more fake files throughout on one or more file shares with the assumption that any CryptoLocker infection will attempt to change and encrypt those files. Once detected, we can trigger a counter measure such as stopping the server service. The three biggest risk factors with this approach are:

  • Accidental modification by a user
  • CryptoLocker detects (and skips) the honeypot files
  • The bait files get modified too late

But not to worry – we can mitigate all of the risks.

Accidental Modification
Since any unsuspecting user with write access may accidentally modify or delete our bait file, it’s possible that some users curiosity may result in some sort of a accidental DoS attack. Making the file read-only defeats the purpose of detecting CryptoLocker of course, since CryptoLocker itself won’t be able to modify it. I was able to come up with two possible solutions for this problem:

1. Give the file a boring name which discourages users from opening it (e.g. meeting_notes_cl1.docx)
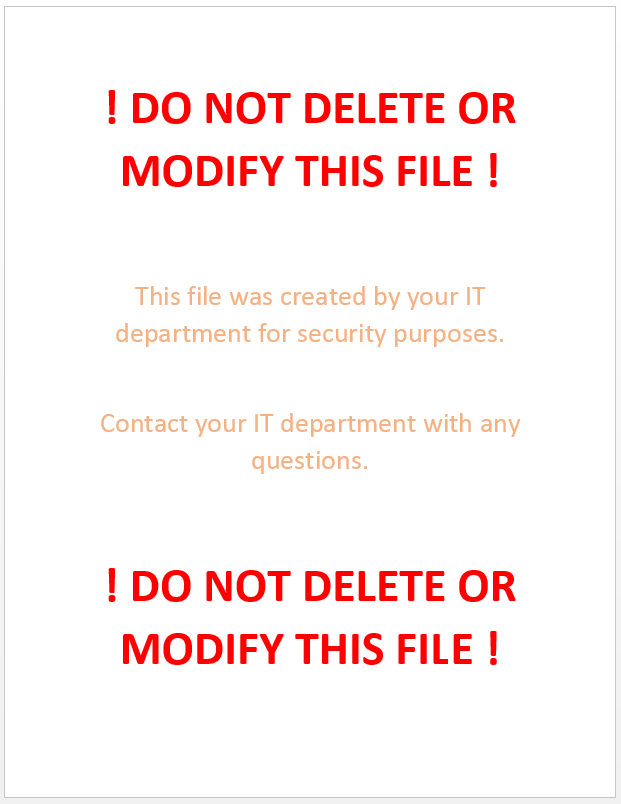
2. Put clear instructions into the file in large font, instructing users not to modify or delete the file. I’d recommend against mentioning any words like CryptoLocker, Virus, etc since CryptoLocker may be parsing the contents of the file.

Example Bait File

Honeypot is not sweet enough
Since we don’t have access to CryptoLocker and its constantly evolving code, we don’t know whether it has any honeypot detection capabilities, and if it does, how it attempts to detect them. Since I’m rather safe than sorry, I’m assuming that it has some basic capabilities. It could be as simple as skipping files which are smaller than a pre-defined threshold or looking for specific file names. E.g., based on this article CryptoLocker could now skip any file named meeting_notes_cl1.docx. To maximize our chances for success:

1. Make sure the file is not too small and exhibits properties of other office documents (e.g. 1Mb in size, multiple pages)
2. Give the file a unique, meaningful name, see previous paragraph.

Once you have created the file, place it strategically on your file server among other office documents. I recommend deploying multiple honeypot files if you have multiple file shares. It may be advisable to give the files unique names (e.g. meeting_notes_cl1.docx, meeting_notes_cl2.docx, …) as well.

Too little, too late
The bait file getting modified too late is the biggest risk unfortunately. If you have a directory with 50,000 files but only one bait file, then it won’t help us to detect CryptoLocker. Since we don’t know how CryptoLocker enumerates files (alphabetical, sorted by size, …), it’s probably best to sprinkle them throughout the various vulnerable file shares, using file names which start various letters of the alphabet, e.g.:

  • a_meeting_notes_cl.docx
  • m_meeting_notes_cl.docx
  • s_meeting_notes_cl.docx
  • z_meeting_notes_cl.docx

A name pattern is not required but helpful when configuring EventSentry later, since it allows you to just specify a wildcard (e.g. *_meeting_notes_cl.docx) instead of specifying dozens of files manually.

Creating multiple bait files is particularly important for newer versions of CryptoLocker which doesn’t always parse/encrypt all directories. So it’s best to create multiple bait files and distribute them across multiple directories, e.g.:

  • marketing\m_meeting_notes_cl.docx
  • sales\a_meeting_notes_cl.docx
  • accounts_payable\z_meeting_notes_cl.docx

This way we’ll have a higher chance of detecting malicious behavior. CryptoWall is fast (of course depending on the speed of the infected host) and can often encrypt tens of thousands of files in an hour.

Implementation
We will use EventSentry’s File Checksum Monitoring feature to monitor the bait files and trigger events when one or more of these files are changed or deleted (=renamed). When they are, we will trigger a script which will stop the server service on the file server in order to avoid more damage being done. Click here to learn more about EventSentry’s architecture.

Monitoring files only for (checksum) changes is no longer sufficient since newer variants of CryptoWall not only modify but also rename (and subsequently delete) documents.

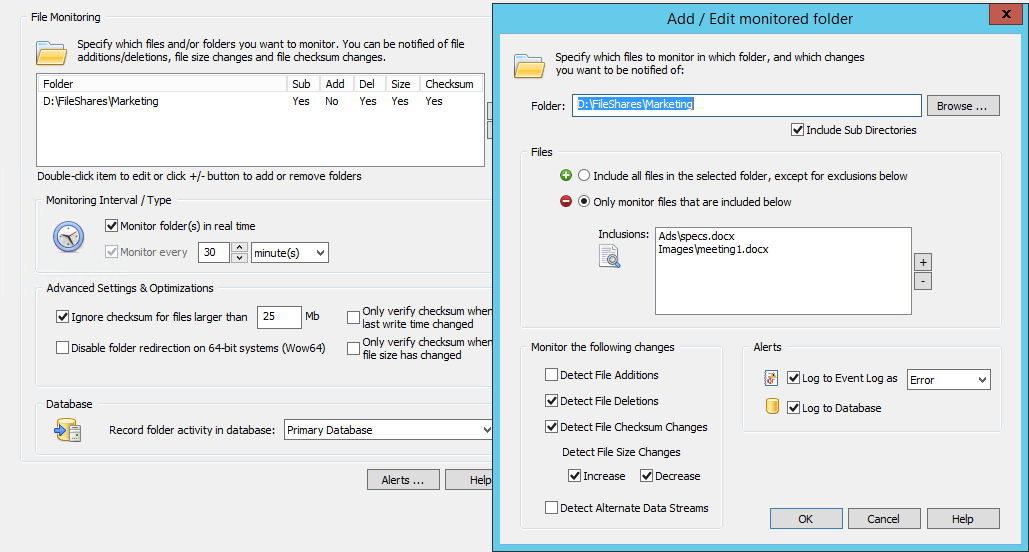
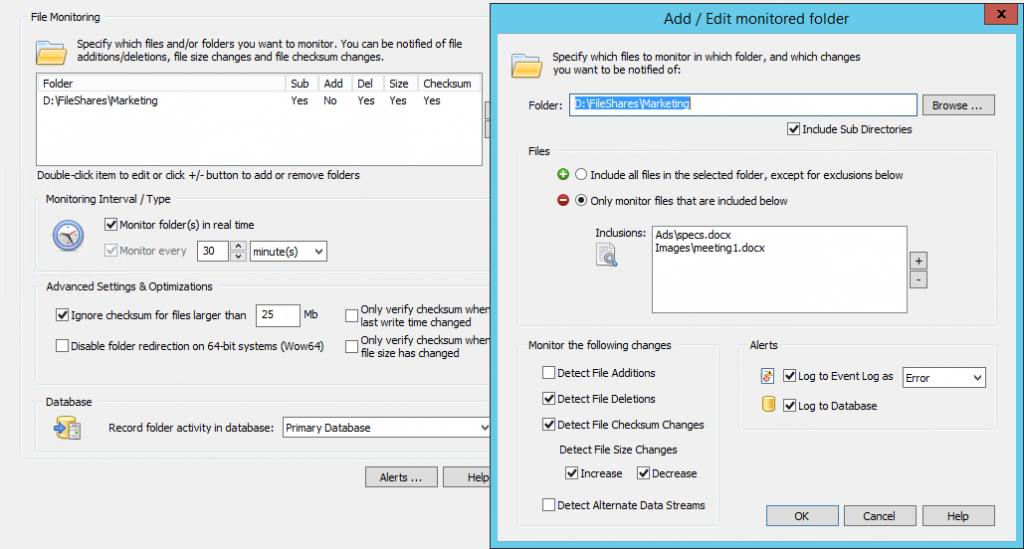
In EventSentry, create a new System Health package with the name “CryptoLocker Detection” and assign it to any server on your network that is monitoring with EventSentry and is serving files through a file share. Now, add the “File Checksum Monitoring” object to the package and ensure the following:

  • “Monitor folder(s) in real time” is checked
  • Disable (uncheck) both “Only verify checksum when ..” optimizations

Then, click the “plus” icon to add the (first) folder where a bait file exists to the list of monitored folders. There are a few things to consider when setting this up

  • The folder/directory name should be specified as it exists on the file server, UNC paths are not recommended.
  • Check the “Include Sub Directories” check box you are monitoring files in sub folders
  • Check “Detect File Deletions” and “Detect File Checksum Changes”. File size increases and decreases may also be checked but is not required.
  • Configure the “Files” section to “Only monitor files that are included below” and specify the file name either with a full (relative) path or with a wild card.
  • Select a severity of “Error” under “Log to Event Log as”

File Monitoring Configuration

Example
Your file server has a directory called C:\FileShares\Marketing with two sub directories, Ads and Images. If we were to add a bait file to both subdirectories (say specs.docx and meeting1.docx) then we would specify C:\FileShares\Marketing as the folder, and then add

  • Ads\specs.docx and
  • Images\meeting1.docx

as the files to be monitored. This is because we always specify the path relative to the main folder being monitored when specifying the file names.

Splendid, EventSentry will now log an event to the event log when any of these files change. Try it out – open the file in word, make a change & save – you should get an alert in the event log almost instantly.

Process action to stop the server serviceDive! Stopping the Server Service
Stopping the server service may seem like a drastic step, but it’s unfortunately the most efficient way to prevent an impending CryptoLocker infection from spreading. Sure, blowing up the bridge might seem crazy at first, but if it prevents an army of Zombies (who obviously can’t swim) from entering your town, then we can probably live with the collateral damage.

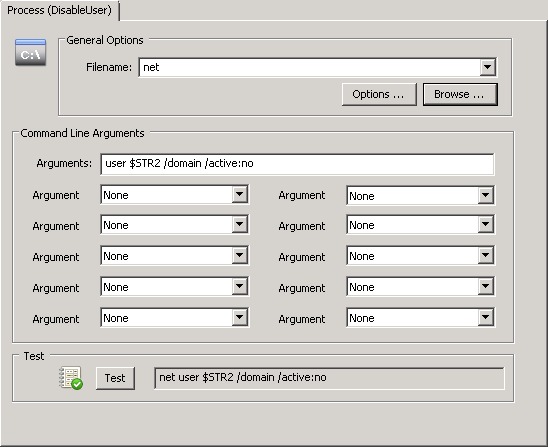
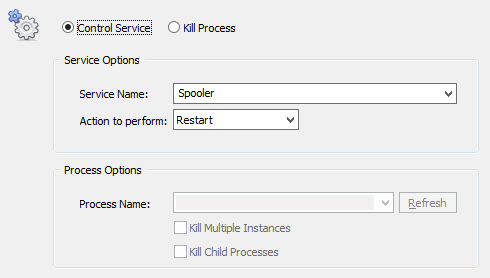
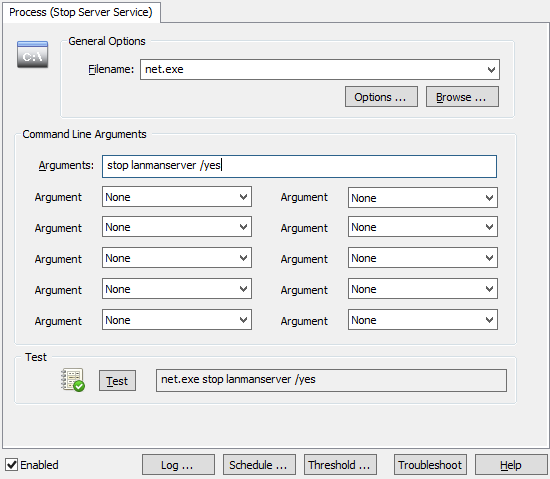
You can stop a service in 2 ways with EventSentry; with the “Service / Process Control” action as well as with a custom script. Creating a “Service / Process Control” action is easier, but only works for stopping services which have no dependencies. You can probably guess where I’m going with this – the server service depends on other services (e.g. when the “File Sharing Role” is enabled) and thus cannot be stopped with the EventSentry action. Consequently we will go a different route and create a process action instead, which essentially allows you to trigger any process, script etc. Better safe than sorry.

Right-click the Actions container and click “Add” to create a new action called “Stop Server Service”, and select “Process” as the action type. Specify “net.exe” as the Filename, and “stop lanmanserver /yes” as the command line arguments. The “/yes” switch ensures that any service which depends on the “Server” service also gets stopped.

Connecting the dots
Since we now assume that a modification of one or more of our bait files only happens when a CryptoLocker outbreak is under way, the only thing missing now is to have the file change event trigger the process action and shut down the service.

EventSentry uses the concept of “Event Log Filters” to link events to actions, such as sending an email and/or triggering a process. Filters need to be part of an “Event Log Package”, and we can now either create a new package or add our filter to an existing package. For documentation purposes and to keep things orderly we will create a new event log package called “CryptoLocker Prevention”.

We do this by selecting the “Packages – Event Logs” container and clicking “Add” from the ribbon, you can also right-click that container. Give it a descriptive name and select the package, which we now need to assign to one or more hosts and/or groups. Click “Assign” in the ribbon to assign the package, you can also make the package global by clicking the respective button.

With the package all ready to go, we now need to add the filter. With the package still selected, on the ribbon click the “Add” button under “Event Log” and select “Include”. This event log filter, as is, would not apply to any event, since no event log and no severity is selected.

Event Log Filter

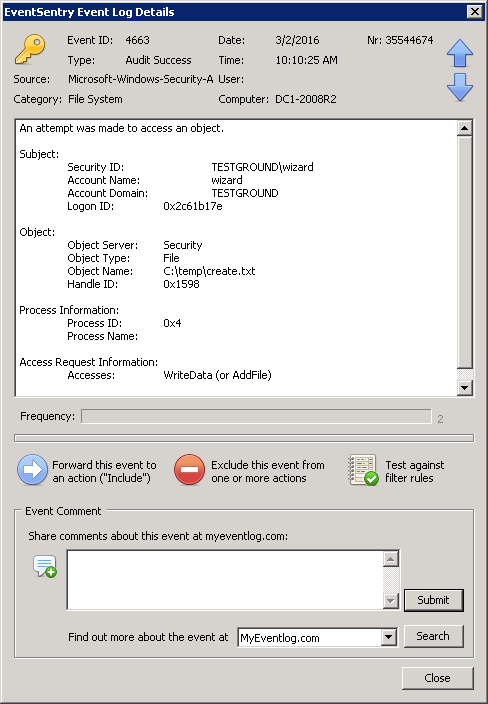
Anything detected by the EventSentry agent (e.g. a file checksum change, service status change, low disk space) is logged to the Application event log with the source “EventSentry”, a matching category (e.g. “File Monitoring”) and usually with a configurable or dynamic severity. In our case the file checksum change events will be logged as Errors, as configured earlier.

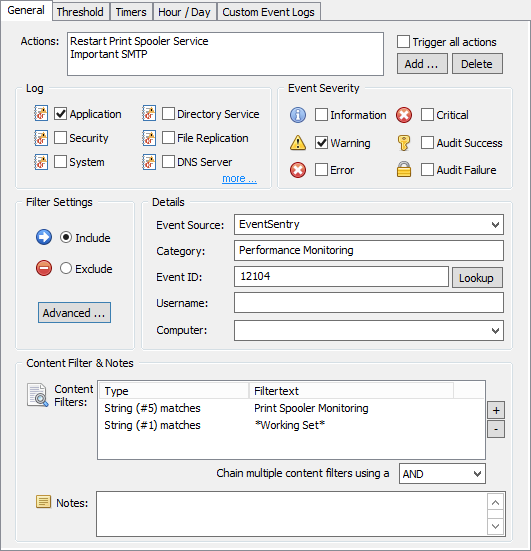
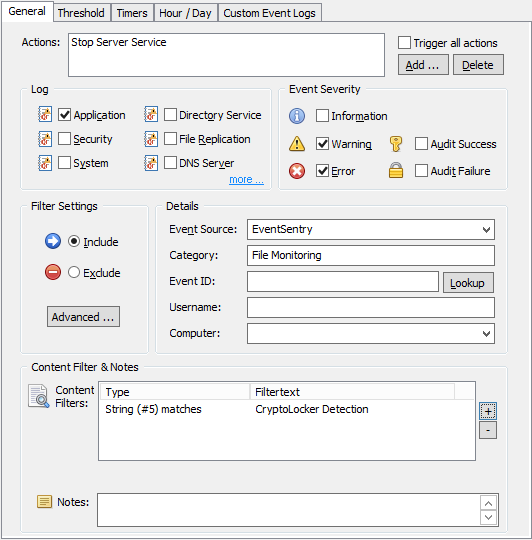
So let’s first configure the event properties as shown in the screenshot:

Log: Application
Event Severity: Error
Source: EventSentry
Category: File Monitoring

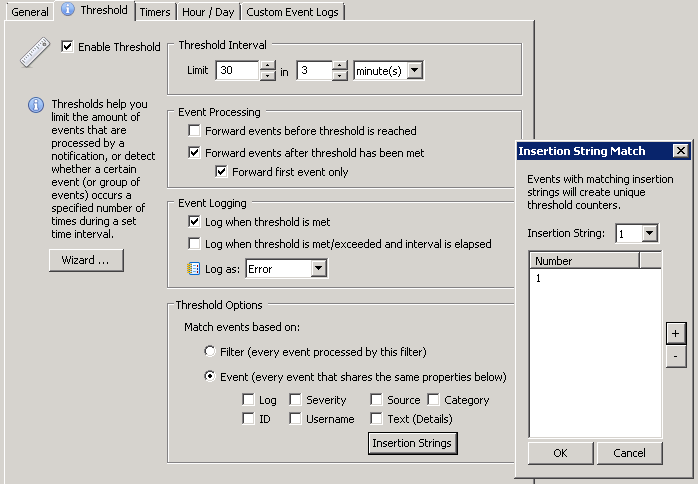
We also add the “Stop Server Service to the list of actions to be triggered. Since we may have other system health packages which log File Monitoring events, we want to make sure that this filter only applies to those, which we do by restricting the filter further with an event id as well as with a Content Filter.

For CryptoLocker we want to get notified about every change that happens to our bait file. Whether it’s deleted, a checksum change or a file size change. As such, we leave the event id field empty and specify the “File Monitoring” category instead.

Important Note: If you are running a German version of Windows, the category will need to be specified in German (“Dateiüberwachung”) since EventSentry is localized for German.

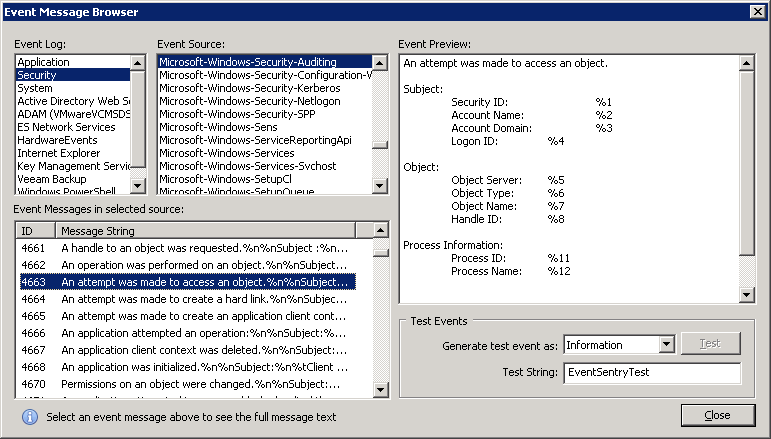
Our filter could still apply to unrelated file checksum changes (e.g. OS files were changed by a Windows Update), but since any file checksum change event includes the package name which triggered the event, we can filter based on that name (we called the package “CryptoLocker Detection”) to ensure that we only match file changes from CryptoLocker. In the “Content Filter” section click the “+” button to add a new content filter.

The quickest way to specify the content filter is to leave the “Wildcard match” setting in place and simply specify *CryptoLocker Detection* as the content filter. A more elegant way is to use an Insertion String match and selecting insertion string 5, which represents the package name (click “Preview” to see the insertion string numbers).

Event Log Content Filter

The setup is now complete, and you can now push the configuration to the remote host(s) which has the bait files and should be protected. If you have multiple file servers with a different directory structure, then you can easily create multiple system health packages which contain a file monitoring object, and assign them accordingly. For example, you could create packages named:

  • CryptoLocker Detection Server1
  • CryptoLocker Detection Server5

The process action doesn’t have to be duplicated, since the stopping the service is the same process for all hosts. The event log filter may need to be adjusted depending on how it was setup. A wild card like *CryptoLocker Detection* would match “CryptoLocker Detection Server5” as well, but an insertion string filter would need to be modified to something like CryptoLocker Detection* in order to match multiple more than one package.