Since Active Directory is the foundation of all Windows networks, monitoring Active Directory needs to be part of any comprehensive security strategy. Up to version 3.5, EventSentry utilized Windows auditing and the security event log to provide reports on:
- User Account Changes
- Group Changes
- Computer Account Changes
While this functionality provides a good basis for monitoring the most relevant changes to Active Directory, we felt that a more comprehensive approach to monitoring Active Directory was needed – without the need to install & maintain yet another product!
ADMonitor is new (optional) component included in EventSentry that vastly improves Active Directory monitoring with these additional features:
- Monitors changes to all objects (e.g. OUs) – not just users/groups/computers
- Captures every attribute change made to an object, not just high level changes
- Provides before & after values for all changes
- Monitors Group Policy changes
- User status reports (show idle users, users with non-expiring passwords, …)
- Monitoring does not require auditing
We’re excited that we can now offer EventSentry ADMonitor to our users who are looking for a more in-depth Active Directory monitoring solution.
Active Directory is essentially a representation of the employees and their roles in your organization. But employees come and go, roles/responsibilities change, contractors get temporary access and so forth. But while adding users and additional access is usually reflected properly in Active Directory (otherwise IT would get a call because somebody presumably can’t do their job), removing access is often forgotten. As a result, users that should have been removed from AD a long time ago continue to exist. With ADMonitor it’s easy to identify orphaned user accounts (and many others) and keep your Active Directory lean and clean.

Since a significant development effort stands behind ADMonitor, it will be offered as an optional component that is licensed on a per-user basis. Pricing is very competitive with other solutions and we also offer bundle discounts to customers who already own or will purchase agent licenses; please request a quote here.
But enough theory, let’s look into the installation, configuration and reporting of ADMonitor.
Installation
Since ADMonitor is a component of EventSentry, it’s easily activated as part of the main EventSentry setup. Just like with other components of EventSentry (Heartbeat Monitor, Collector, …), users have the option to enable ADMonitor during the post installation setup procedure.
ADMonitor can be installed on any host that is part of the domain that needs to be monitored, it does not need to be installed on a domain controller.
Immediately following the initial installation, ADMonitor will initialize itself by creating an offline copy of all Active Directory objects. This process can take from a few seconds to a few minutes, depending on the number of objects in AD, connection speed to the domain controller as well as the overall performance of the host running ADMonitor.
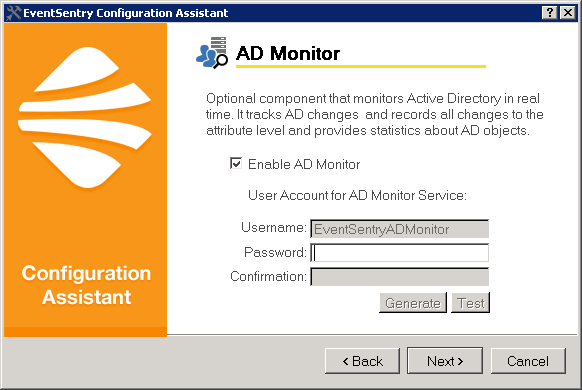
Configuration
The initial configuration of ADMonitor is simple and only requires you to pick a password for the ADMonitor service account. If you’re adding ADMonitor to an existing installation you may also need to select the appropriate EventSentry database action to which ADMonitor reports changes. Otherwise, ADMonitor is ready from the get go and will monitor all Active Directory changes.
Reporting
ADMonitor provides three types of reports:
- Object Changes
- Group Policy Changes
- User Status
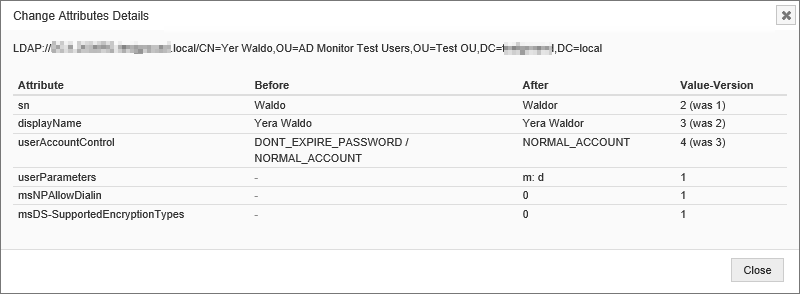
Object Changes
Shows any change made to an AD objects. Reports can be filtered on the type of action performed (added, removed, modified), on the object type (user, group, organizationalUnit, …) and on the user who performed the action.
Note that the detailed changes to group policies are available in the “Group Policy Changes” report below. Of course you can expect the same type of summary view you’re already used to from most other EventSentry features and create reports like:
- Show all changes to organizational units
- Show all new objects created
- Show all users that were changed
- and more
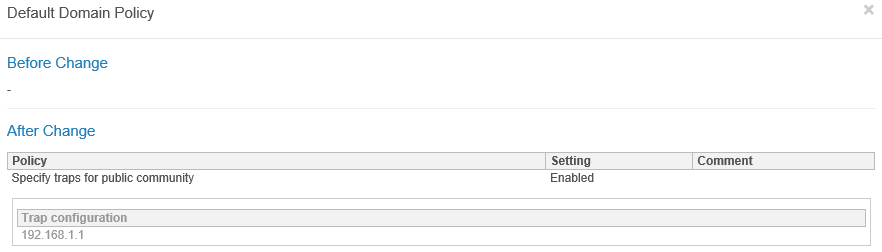
Group Policy Changes
When a group policy is changed, it is first indicated on the “Object Changes” report, since the versionNumber attribute of the AD object changes. The actual group policy settings themselves are available on the “Group Policy Changes” report however, since group policy settings are not stored in AD.
The screen shot below shows that the Default Domain Policy was changed, with the Specify traps for the public community setting being enabled.
Users
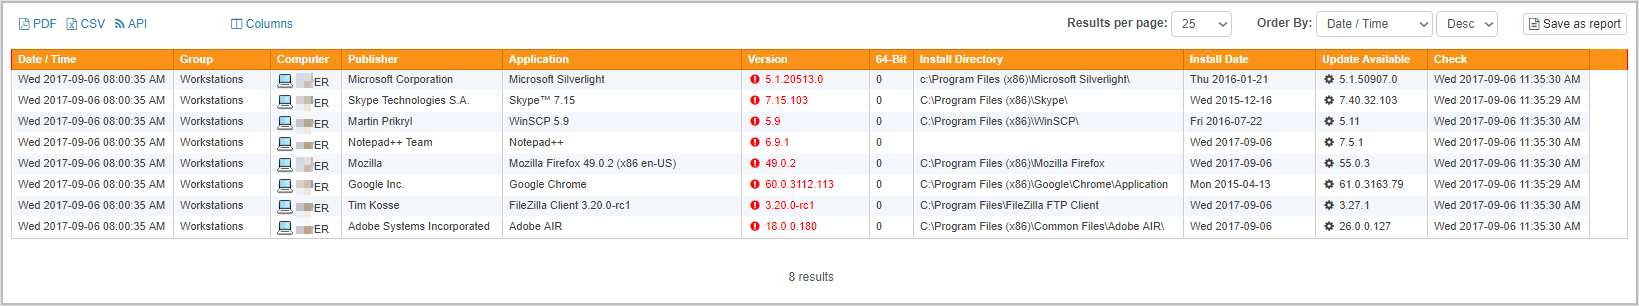
The users report helps you identify potentially problematic user accounts such as idle users, users who haven’t change their passwords in years and others.
This report contains a list of all user objects in Active Directory including the following details:
- Name, Full Name, SAM Account Name, Path, UPN
- Administrative Account (yes/no)
- Disabled (yes/no)
- Password Never Expires (yes/no)
- Password Expired (yes/no)
- Password must change (yes/no)
- Locked Out (yes/no)
- Last Logon
- Password Last Set
- Account Expiration Date
- Creation Date
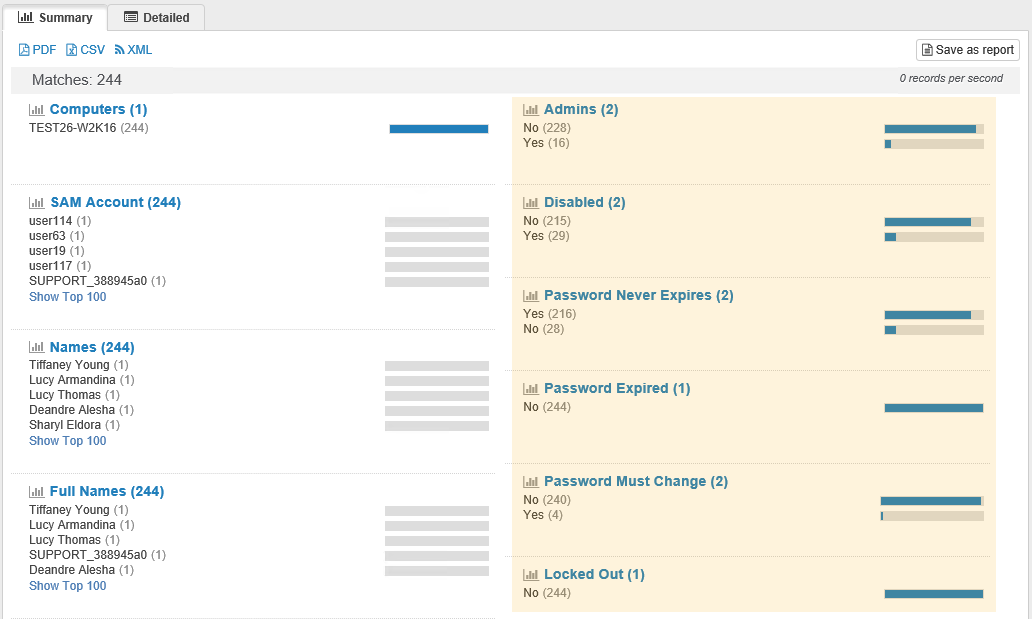
With ADMonitor you can now get detailed user stats with just a few clicks and quickly identify user accounts that need to be reviewed, changed or deleted. Of course you can also schedule all reports directly from the web reports and get daily/weekly AD status reports directly in your inbox, e.g.:
- List of all Group Policy changes
- List of all idle user accounts
- List of all newly created users and/or groups
You can also create your own reports for just about anything that involves a change to an Active Directory object, for example all organizational units created in the last 24 hours.
ADMonitor also includes a number of stand-alone utilities that support advanced features such as filtering and email notifications that I will cover in a future post.
With ADMonitor, EventSentry users can now gain the additional visibility needed to fully audit all Active Directory & Group Policy changes. As a result, EventSentry users can more easily enhance compliance, security and accountability in their network without the need to install additional software – saving both time and money.