We are very excited to release EventSentry v3.3, a major update to our award-winning monitoring solution EventSentry, less than 10 months after the release of the previous major version 3.2. Version 3.2 included the collector component which supports secure and reliable communication with remote agents as well as better database throughput, switch port mapping and many improvements to the web reports.
I’d like to also thank everyone who took the time to fill out our annual survey – we read every single response in detail. If you haven’t taken it yet then you can still do so here.
The v3.3 release, which builds upon some of the architectural changes we have made in v3.2, and offers new functionality to help you:
- Visualize, measure & investigate network traffic better with the new NetFlow component – with discounted introductory pricing until 12/31 2016!
- Spend less time managing agents – the collector can now push configuration as well as agent updates automagically – think laptops!
- Deployment via MSI is much easier – MSI file creation now only takes a few seconds
- Investigate issues faster with email alerts which have geo location, reverse lookups as well complex security codes included inline
- Visualize any data in the web reports more easily with additional dashboard tiles and treemaps throughout
- Managing and using custom event logs is now more straightforward and scalable
- Database throughput has been improved for Syslog data and delimited log files
- Even more advanced filtering is possible with filter chaining and insertion string override via regular expressions
- Communicating and documenting your network has just become a lot easier – add notes and/or upload documents in the web reports
- Monitor 64-bit operating systems with a native 64-bit agent
With a brand new component and many new features in a variety of areas, v3.3 will have something of interest for everyone. Let’s dive in and look at the new features in more detail.
NetFlow
NetFlow is a new component which is part of the “Network Services” service (along with Syslog, SNMP, ARP) and is licensed separately. Pricing is very competitive and an additional introductory discount will be available until the end of this year, 12/31 – including competitive upgrades. You can request a quote here.
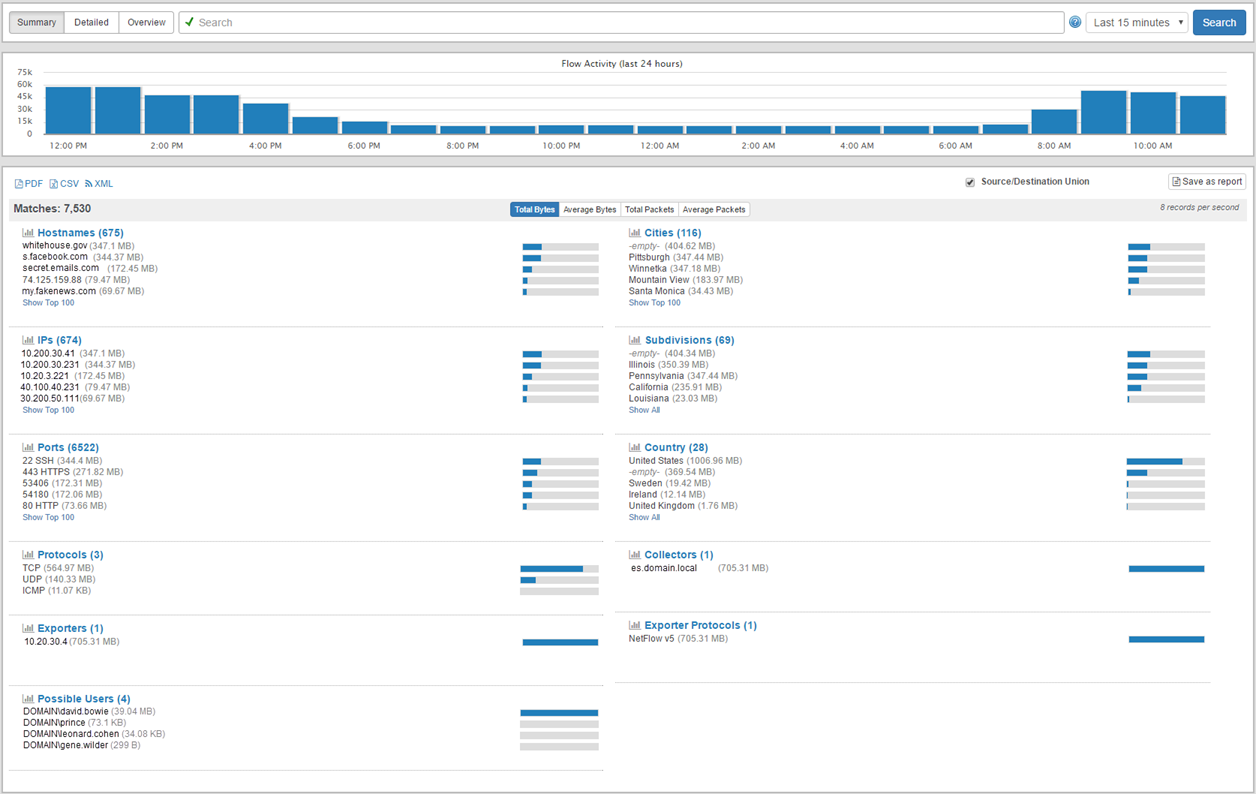
Collecting NetFlow data allows you to see all traffic meta data which passes through network devices that support NetFlow, including:
- Source IP, destination IP
- Source host, destination IP (when resolvable)
- Source port, destination port
- Geo location (when available)
- IP protocol used
- Amount of traffic sent and received
- Number of packets transmitted
EventSentry v3.3 currently supports the NetFlow v1, v5, v9 as well as sFlow flow protocols. NetFlow is usually supported by most commercial routers and firewalls whereas sFlow is most commonly supported by switches. NetFlow is generally preferable over sFlow – especially for forensic analysis since sFlow samples traffic and only sends every nth flow. sFlow can be preferable when dealing with large amounts of data, but EventSentry’s NetFlow implementation (as well as NetFlow itself) has a way to group flows and therefor condense traffic.
Do you need NetFlow, and is it worth looking into? Without NetFlow there is impossible to know which hosts communicate with each other (unless you capture network traffic). What traffic enters the network, and what traffic leaves it? Broadly speaking, implementing NetFlow lets you:
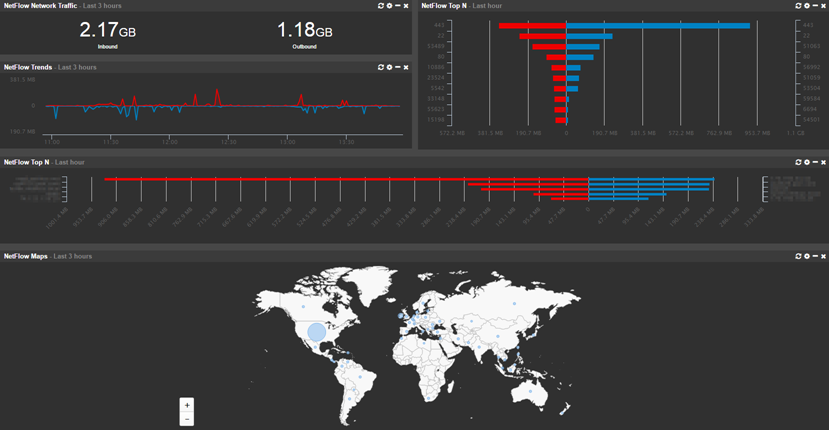
- Visualize all network traffic in a variety of ways and reports
- Analyze network data for forensic purposes
- Utilize network traffic data for troubleshooting purposes
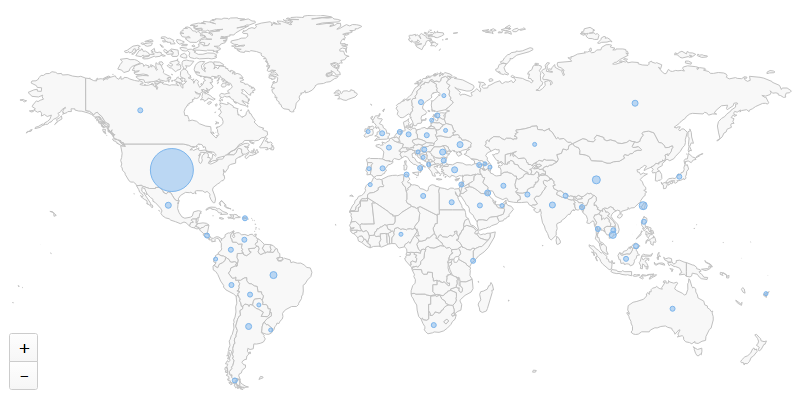
- Map network traffic to geo location
- Correlate network traffic with Active Directory users (requires workstation monitoring)
- Measure bandwidth utilization
On the EventSentry side, setting up NetFlow should take less than 5 minutes; and setting it up on the network device side is generally just a matter of enabling NetFlow and pointing it to EventSentry.
Geo Location
EventSentry ships with the GeoLite geo database from MaxMind which does a good job of associating IP addresses with physical locations down to the city level. If you are looking for more accuracy however, then you can also purchase the full geo location database from MaxMind here.
Active Directory User Correlation
A unique feature of EventSentry’s NetFlow implementation is the ability to correlate workstation logins with network traffic, making it possible to associate network traffic with individual users. This requires that workstations are monitored with EventSentry and works best when users have a dedicated workstation.
Agent Management & Deployment
If you are utilizing the collector service then you have now a great time-saving feature available. Pushing a configuration update to remote hosts after you made a change or deploying agent updates after a patch installation are a thing of the past once you activate the respective options in the collector dialog.
Managing automatic configuration updates can be done in 2 ways: Either by automatically deploying a configuration update after you click “save”, or by deploying only approved configuration updates (recommended). If you select the latter, then you just have to click the new “Save & Deploy” sub-option on the ribbon and the collector will do the rest. It’s no longer necessary that the EventSentry agent is directly reachable from the management console; it will receive the latest configuration as soon as it connects to the collector.
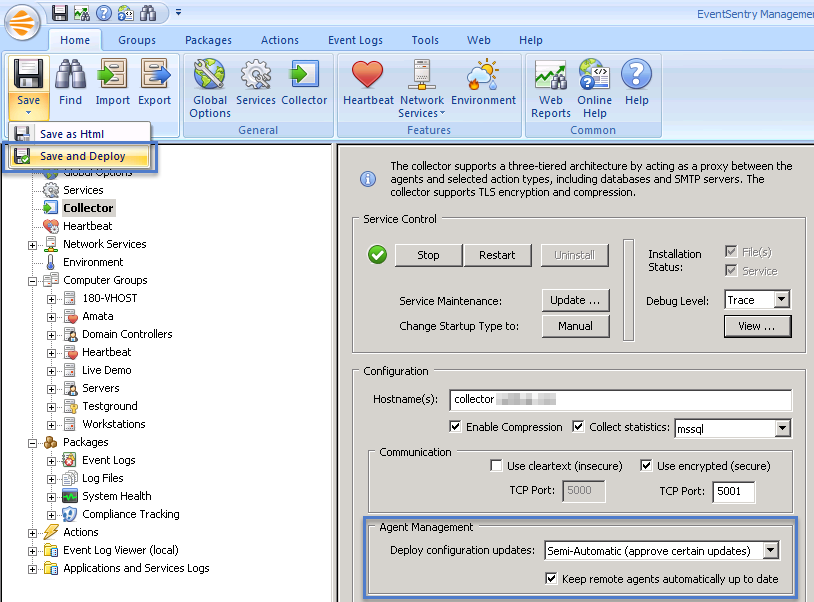
Please note that you will still need to manually deploy a v3.3 agent once in order for automatic agent updates to work, since the self-update code is embedded in the new agents.
Creating MSI files has also been greatly simplified – a x86 and x64 agent MSI file is created with just a few mouse button clicks. Manually editing MSI files with tools like ORCA is a thing of the past. The only prerequisite is the (free) WiX Toolset which has to be installed only once.
Monitoring Laptops
In addition to saving most EventSentry users a lot of time, these new deployment features also make it possible to monitor laptops which aren’t permanently connected to the network. Simply deploy the agent MSI file with your favorite deployment tool (or deploy with the management console) and enable the configuration and agent management options in the collector. From that point on, any agent connecting to the collector will automatically receive the latest configuration AND any new agent updates – completely automatically – no matter where in the world they are located.
64-Bit Agents
EventSentry v3.3 now ships with both a x86 and x64 agent, so that 64-bit editions of Windows can be monitored natively. The key benefit of this change is that 64-bit only performance counters can now be monitored, these counters were off limit with 32-bit agents. Utilizing 64-bit agents also results in the following changes:
- Agents will be automatically converted to 64-bit when v3.3 is deployed. It is not possible to use a 32-bit v3.3 agent on a 64-bit version of Windows
- File system redirection via “Sysnative” or in the File Checksum Monitoring packages is no longer necessary
- Memory consumption will be slightly higher compared with 32-bit agents
Please note that EventSentry has not completely migrated to 64-bit yet, some components (management console, heartbeat agent, web reports) are still shipped as 32 bit executables. We plan on migrating all components to 64-bit by the end of 2017.
There are just too many new features in v3.3 to fit them all into one blog post, so stay tuned for part 2 which will follow shortly.
Your NETIKUS.NET team.