The System Administrator! AKA the Sysadmin. The keeper of the network, computers – well basically all things technology. The one who is hated for imposing complex passwords and other restrictions, but taken for granted when everything works well.
They are the first to be called when “facebuuk.com” reports: “domain does not exist”. They are the first to be contacted in the early hours of the morning with a “I can’t print” complaint – without ever receiving a cordial “Good morning, how are you?” greeting. They are the ones who are expected to fix a personal laptop, with the promise of some donuts that never arrive.
If you are a Sysadmin, then I’m sure you’ve been there. While Diana at the reception desk keeps calling you when she can’t listen to her favorite radio because the page won’t load, but never opening a ticket. Then you are reading that this January’s Patch Tuesday has about 98 CVEs, 10 of which are considered critical.
In the list of CVEs, you recognize the usual actors: NTLM, ODBC Driver, RPC, Print Spooler, Microsoft Office, Microsoft Exchange Server, etc. You think, “When are they going to fix everything for good?”
You need to be everywhere at the same time – add paper to Carla’s printer on the second floor, who was hysterical because she couldn’t print.
Alas, it’s too late to go back and choose another career. You have made up your mind, you are going to be the best Sysadmin you can be. Some days you have slight concerns about your mental health, but you roll up your sleeves and keep going – one coffee at a time.
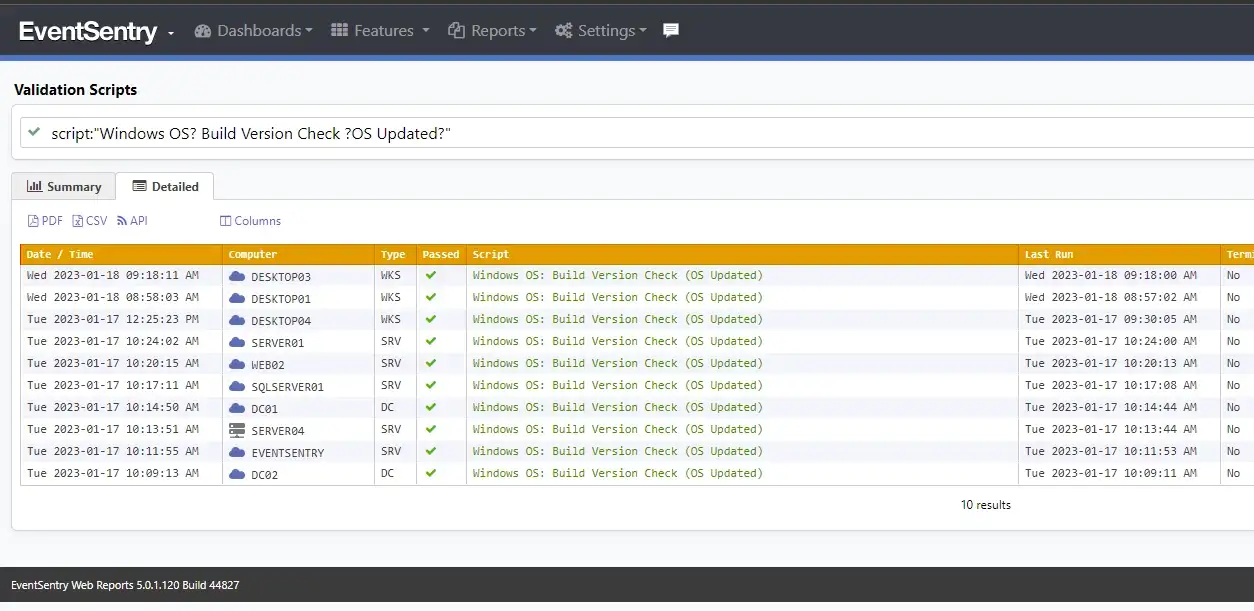
Unfortunately, there is no software to make Carla read the printer error message before calling you. But with EventSentry, you can check if the Patch Tuesday patches have been applied – even if you don’t use WSUS (or especially when you use it). For example, with validation scripts you can quickly see if any machines on the network are not running the latest build (patch) of Windows:
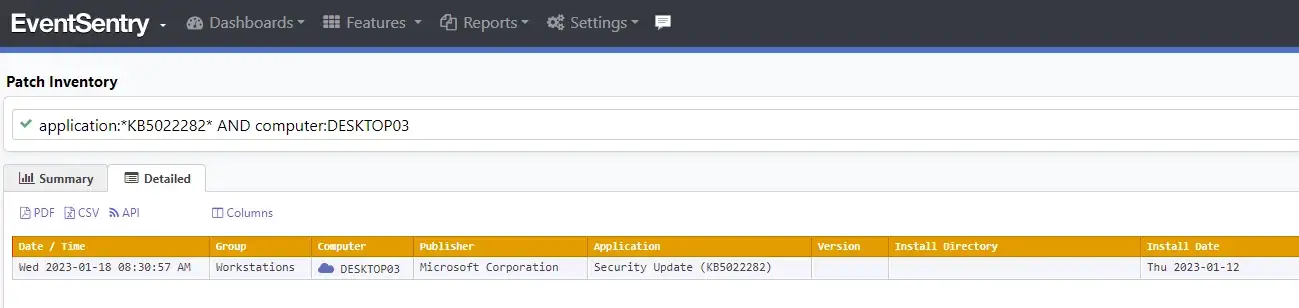
And you can also search if the patch for CVE-2023-21674 (KB5022282) (Windows Advanced Local Procedure Call (ALPC) Elevation of Privilege Vulnerability) was applied on the CEO’s computer:
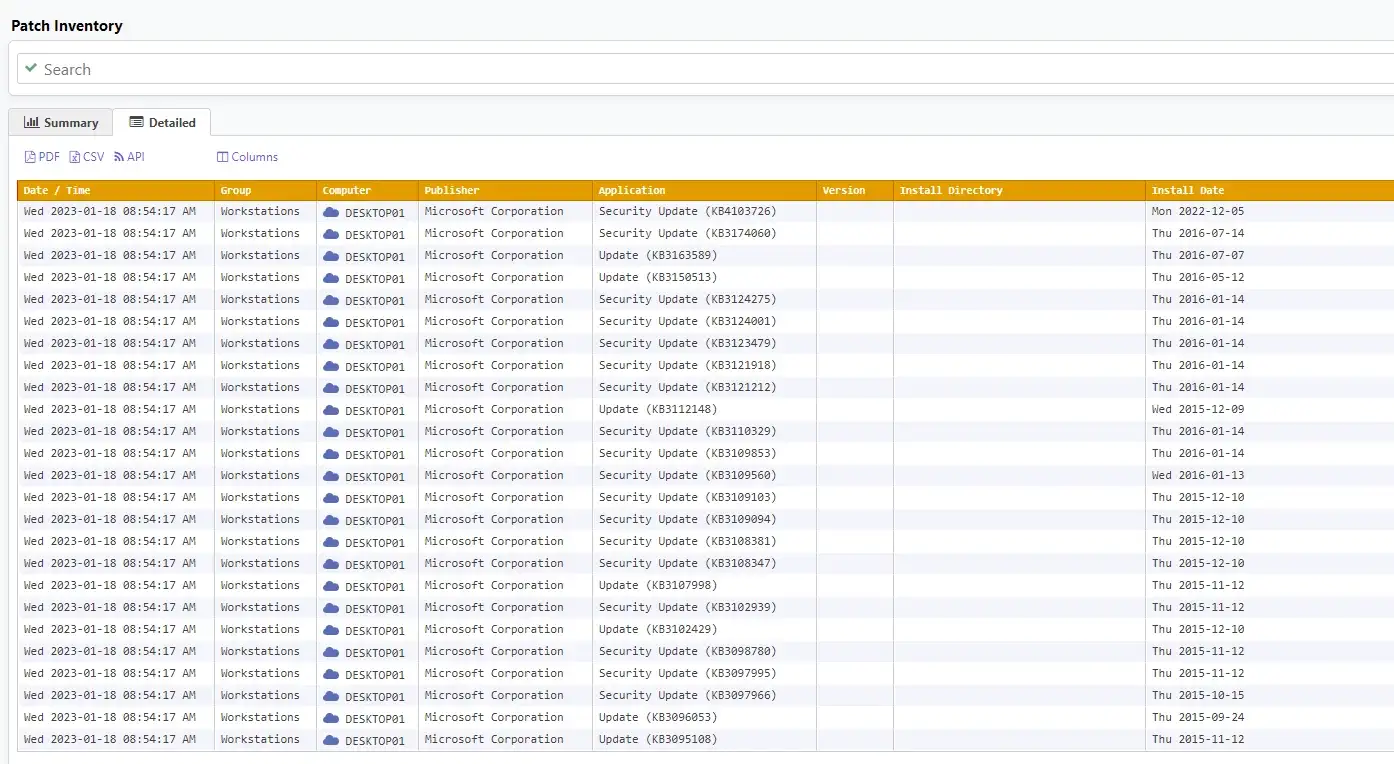
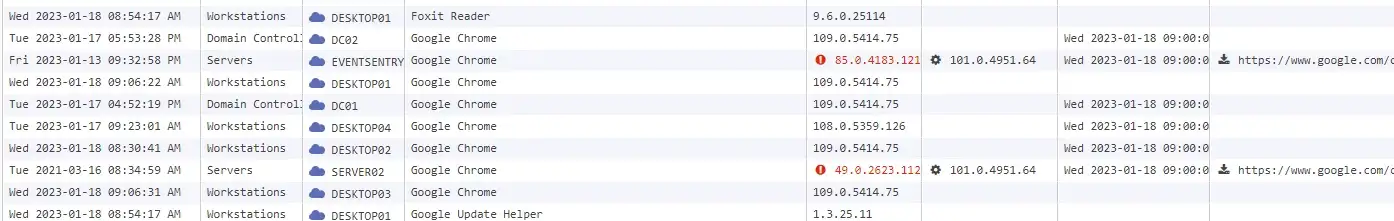
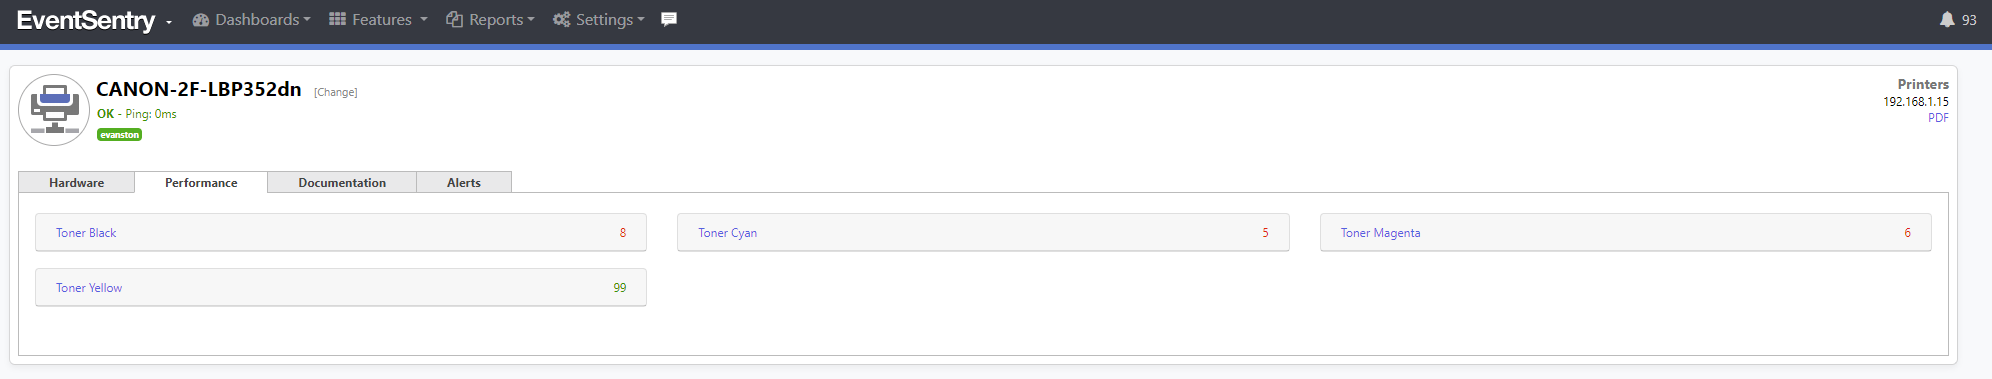
And of course, you can also check if Carla’s printer is out of paper or toner – before making the trip upstairs to her office:
And best of all, everything posted here is included & enabled by default with EventSentry. No need to spend hours configuring or activating options. Simply install EventSentry and you will have access to all of this – out of the box!
In the career of a Sysadmin, there are many day-to-day things that you can’t control. That’s why we created EventSentry, so that you can have control over the network, the devices and, most importantly, the patches. Which of course, leaves you more time to fix Diana’s internet radio!
File Integrity Monitoring, aka as FIM, is a must-have feature for anyone in charge of security. With FIM, one can detect when a critical file, such as a file that belongs to the Operating System, or a key configuration file, is changed. In most cases, configuring FIM is straightforward: If the file changes then generate an alert.
This binary approach (no change = good, change = bad) doesn’t work very well with transaction log files however – files that are allowed to change only in that new data can be appended to the log file. A good example are payment transaction logs: These files record transaction data and are supposed to continuously increase in size, but existing data is never supposed to change.
Regular FIM checksum monitoring doesn’t work well in this case since new data being appended to the files on a regular basis would trigger constant checksum alerts. To solve this problem and prevent tampering of log files, we introduced a new feature to our FIM monitoring capabilities in EventSentry v5.0.1.98: Only verify incremental checksums.
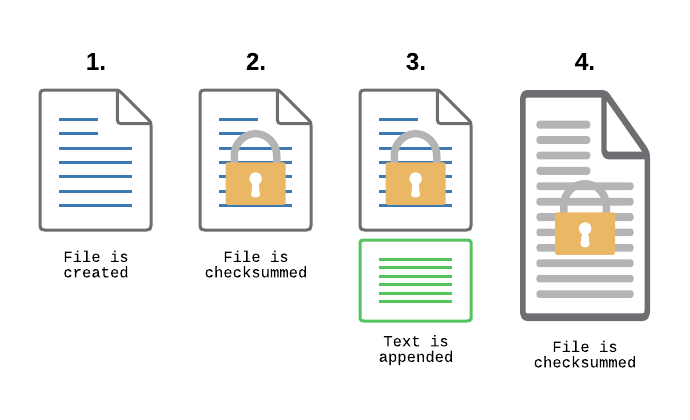
How does that work? Every time the file changes (in most cases that would be data being appended to the file), all data up to the previously known file size is verified. After the new data has been successfully written, EventSentry will re-calculate the checksum and wait for more changes. This means that existing data is not allowed to change and will trigger a checksum alert, whereas new data can be added without issue.
As the file grows, only the part of the file that was previously checksummed is verified
If someone where to change an existing part of the log, even if it was at the same time new data is appended, EventSentry would detect the change and trigger a checksum alert.
File Monitoring still works the same exact way in EventSentry, and all that is needed to activate this new feature is to check the “Only verify incremental checksum” box in the file monitoring dialog. This setting will affect all directories monitored by the package.
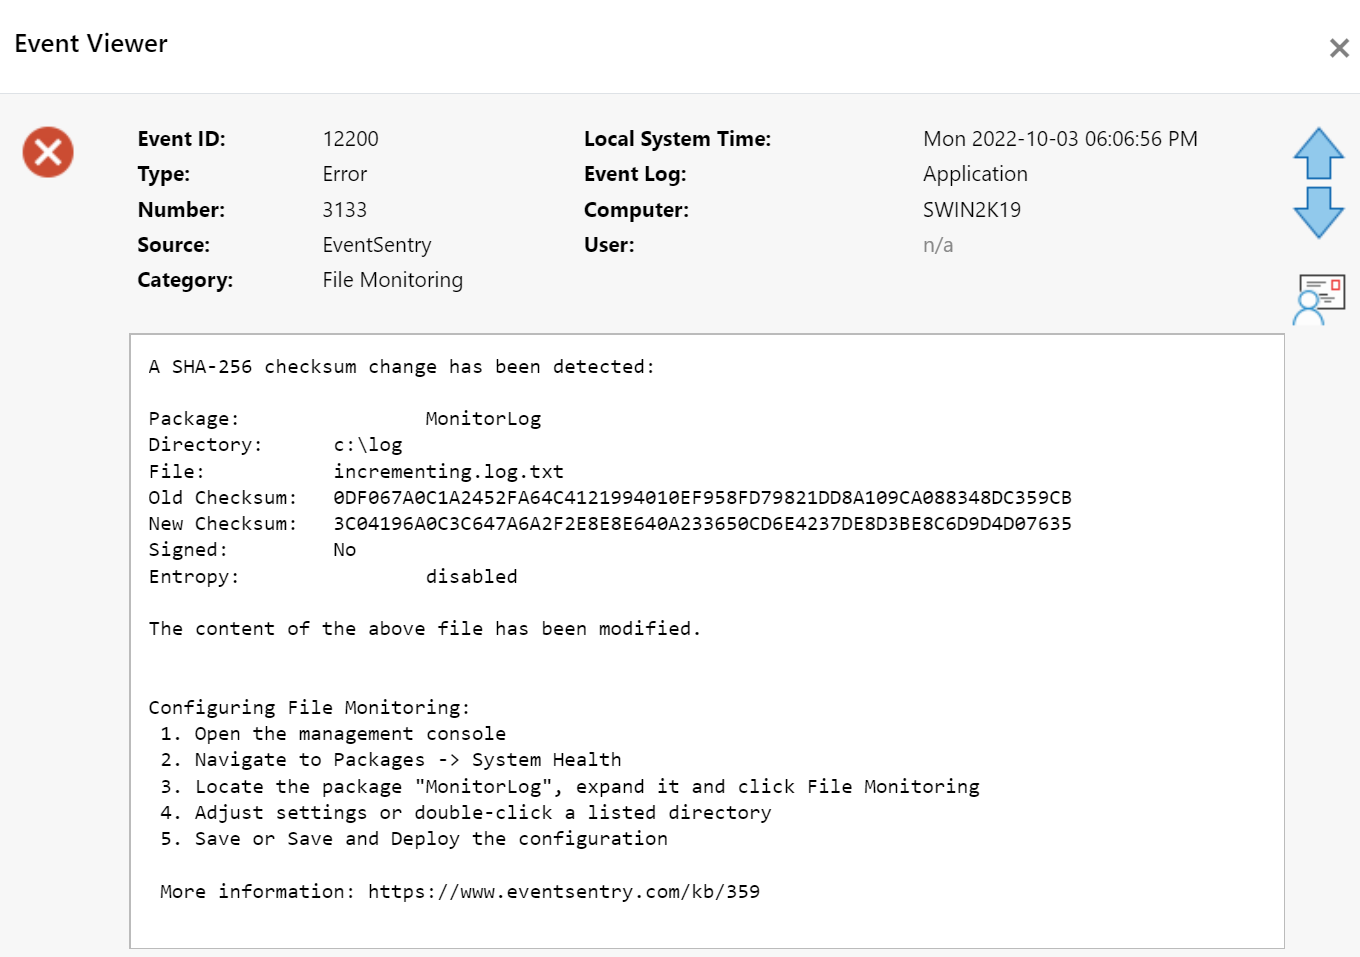
EventSentry alert after a file checksum changed
Other EventSentry features can be leveraged as well for monitoring (transaction log) files to ensure that critical files are not tampered with.
Log File Monitoring: Content of text-based logs can be transferred to the EventSentry database in real time, essentially creating a searchable backup copy of all content.
File Access Tracking: Utilizing NTFS permissions, all (write) access to the log folder can be tracked, providing an access log of every user who made changes to one or more log files.
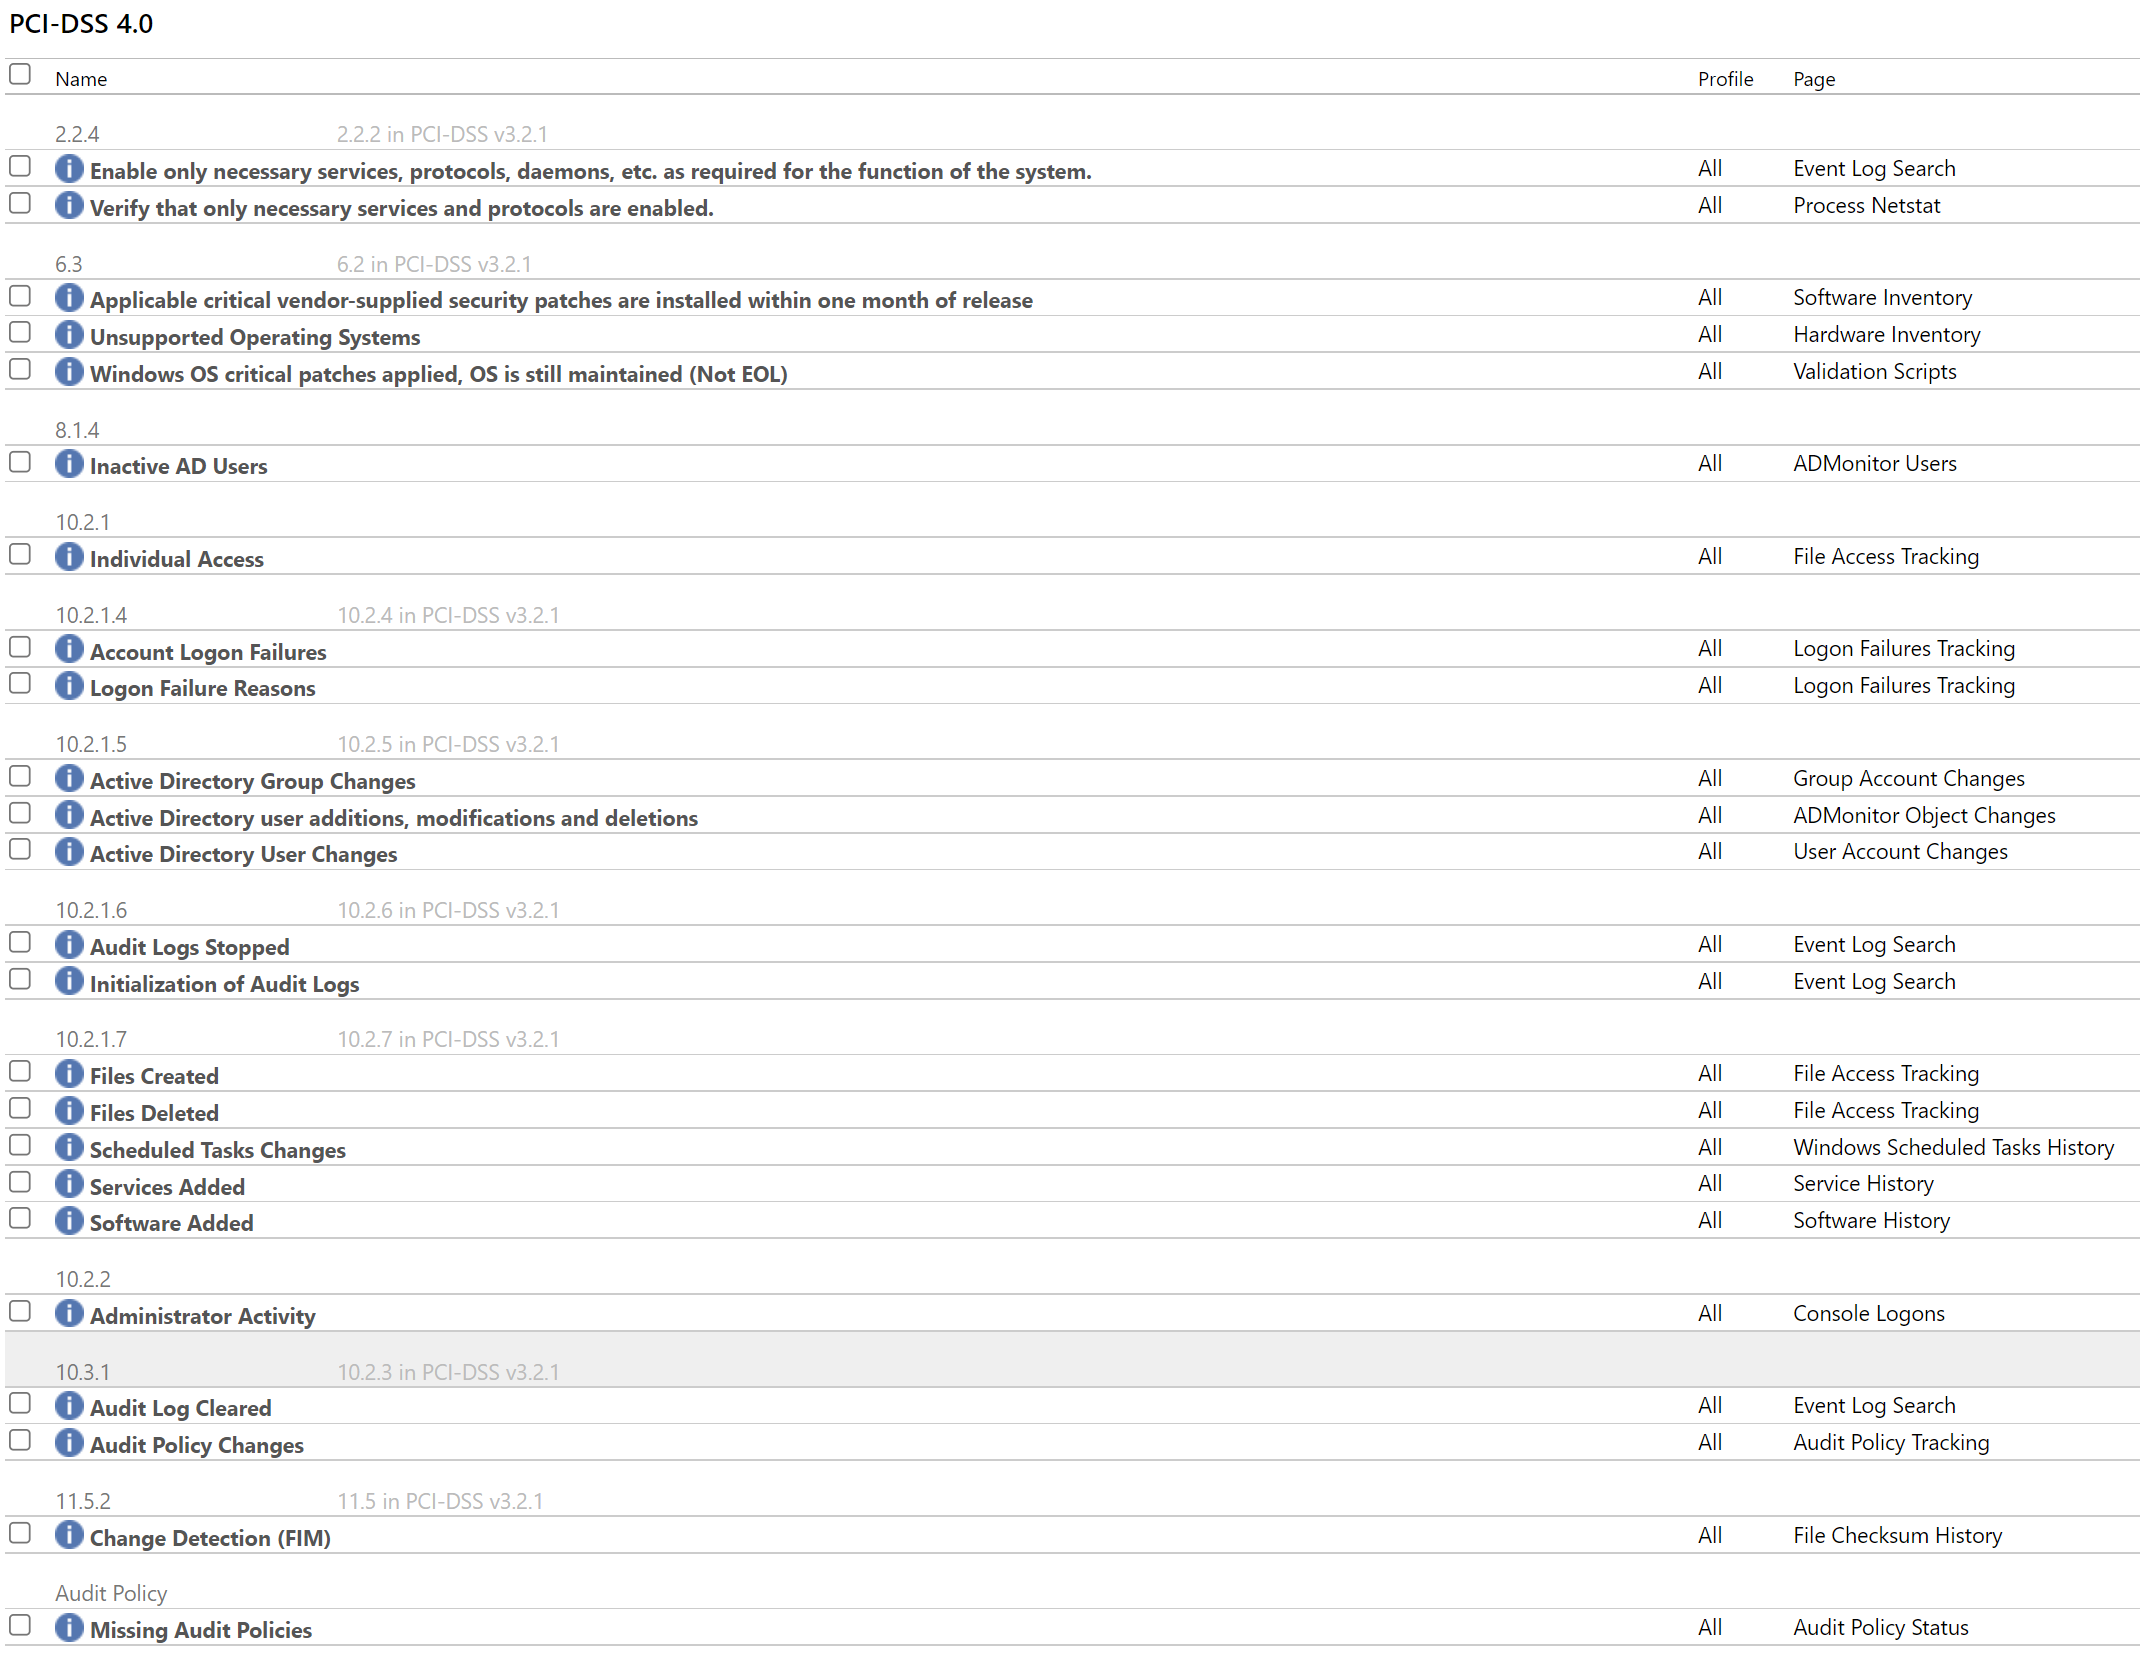
Monitoring files that record transactions is useful even outside of PCI compliance, but if your organization needs to be PCI compliant then EventSentry also includes PCI compliance reports out of the box:
Whether it’s for compliance or improving security in general, FIM is an important security tool. In EventSentry, file integrity monitoring can also be used for automation, for example performing certain tasks when a file is added to or removed from a folder.
I think we’ve all been there before – you log on to a server remotely via RDP, and do the needful – but don’t immediately log off. But then you get distracted by a phone call, an email, a chat, or a good old-fashioned physical interaction with another human being. So when it comes time clock out for the night, you shut down your computer or log off. Or maybe you’ve been working on a laptop and your VPN got interrupted. The result is the same – previously active RDP sessions are automatically disconnected. Or maybe one (not you, of course) purposely disconnects their session so that the next login process is faster.
Well whatever may be the reason, a key issue with disconnected RDP sessions is that, by default, they remain connected indefinitely until the server gets rebooted, you login again (because you forgot to do something?), or a coworker notices the offense and politely requests you log off.
At this point you’re probably thinking “OK, yes, but who really cares“? With all the serious stuff that’s going on around you, you’re probably wondering why the heck you suddenly need to worry about disconnected RDP sessions? Well, disconnected RDP sessions can be problematic for a number of reasons:
Potential Issues
Confusion
It can be confusing when you’re logging on to a server and notice that another user is logged on, even if it’s just a disconnected session. Are they doing important stuff? Can the other user by logged off? Or you’re trying to reboot a server, but the infamous “Other users are currently logged on … ” message pops up. Assuming you’re polite, you’ll reach out to the disconnected fellow to ensure that the user isn’t running any important apps. In short, it’s a pain. And we all have enough pain as it is, do we not?
Security
So this is the fun one and, I admit, the real reason for this blog post (no, it was not the confusion). Turns out that any local administrator has the ability to hijack any disconnected session on the server he or she is an administrator on. And while this doesn’t sound like a huge problem at first (if the user is already an admin, then he can do anything blah blah), there is a very specific scenario where this is a significant security risk. Being an admin on a machine is a great privilege, but hardly the key to the kingdom. If a domain admin (or even worse, an Enterprise Admin!) however logs on to the same host and disconnects their session, then the local admin can promote himself/herself to domain admin at no cost (EventSentry would of course detect this) by simply taking over the disconnected session. The process involves only a handful of commands, one of which is creating a temporary service (EventSentry would detect this also).
Resource Consumption
Processes from disconnected sessions do continue to run and consume some processing power, which can be an issue in environments with limited computing power or cloud environments where you pay for CPU time. It’s unlikely to have a large impact but it could add up for larger deployments.
I’m hoping that we can (almost) all agree now that disconnected sessions have a number of drawbacks, so let’s move on to ways to address this.
Solutions
User Education
While there are ways to forcefully log off idle users (see below), I think it’s important to make your admins aware that disconnected sessions pose a security risk, but also communicate to your users in general that disconnected sessions should be avoided when necessary. While this won’t solve the problem entirely, it will hopefully get some of your users to be more aware.
Notifications
EventSentry users can utilize filter timers to get notified when a user has been logged on to a server too long. Those not familiar with filter timers can learn more about them here. In short, filter timers work with events that are usually logged in pairs – such as a process start/process end, logon/logoff, service stop/service start etc – and can notify you when such an event pair is incomplete. For example, a logon is recorded but not followed by a logoff within a certain amount of time (the time period is configurable).
So in this scenario, a user’s logon event would start a filter timer that essentially puts the original event on hold. It won’t forward it to a notification just yet – only if the timer expires and no subsequent event has deleted the timer. A later logoff event (that is linked to the logon event via some property of the event like a login ID) would end the filter timer. If the logoff event does not happen (or happen too late), EventSentry will release the pending (logon) event and can send a notification to let either the team or the user know (if the login pattern matches email addresses) that the filter time has expired.
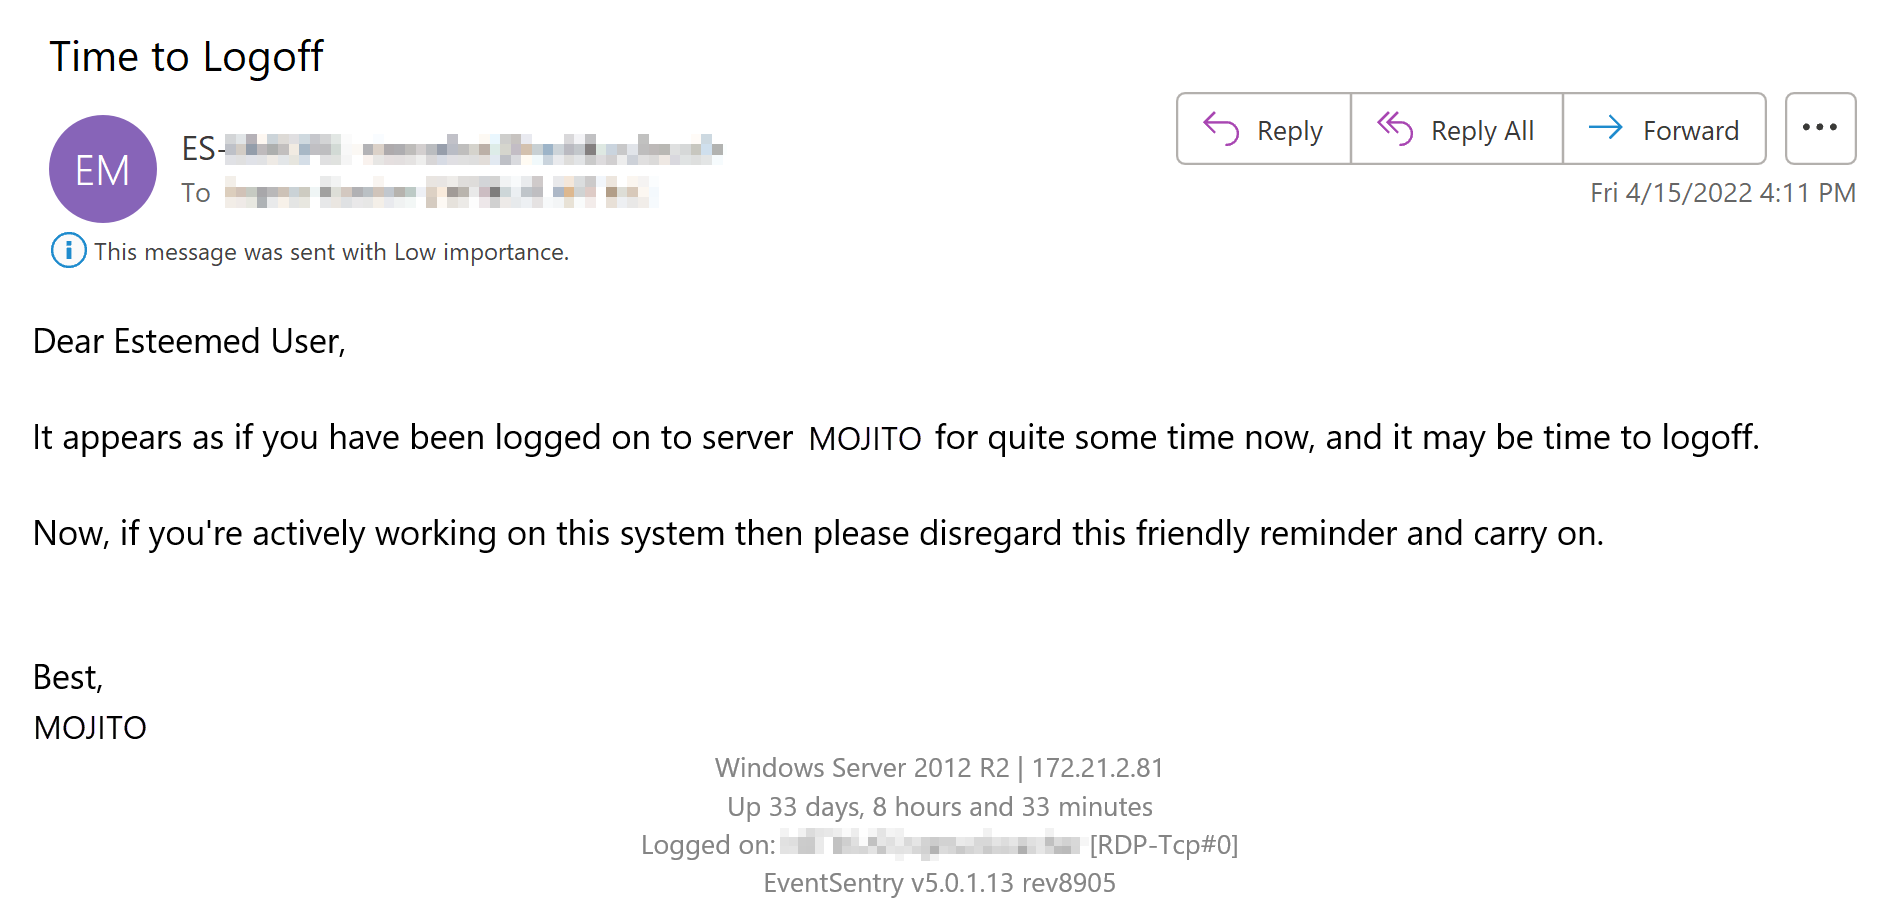
BONUS: If the Windows username can be matched to an email address (e.g. username is john.doe and the email address is john.doe@mycorp.com), then EventSentry can even send an email directly to the user (opposed to a generic email) reminding them to log off. Even better, the email can be customized and provide specific instructions. See KB 465 for instructions on how to configure this in EventSentry. The screenshot below shows such a customized email.
Disclaimer: This method doesn’t necessarily distinguish between users who are logged on and users who have disconnected sessions. It detects that a user has had a Windows session active for an extended time period. In most cases this should work reasonably well to detect disconnected sessions as well. especially with longer timer periods (since most users don’t need to be logged on to a server for many hours).
Forcibly logging off disconnected sessions
When you tried your best the nice way using education and emails and it’s just not working, well, then it turns out that Windows allows you to use the nuclear button – logging off disconnected user sessions after a certain time. Since this can be configured via group policy, implementing this is fairly easy. Simply create a new group policy and assign it to appropriate OU(s) and configure the following setting:
Local Computer Policy
   |-- Computer Configuration
       |-- Administrative Templates
           |-- Windows Components
               |-- Remote Desktop Services
                   |-- Remote Desktop Session Host
                       |-- Session Time Limits
Then simply enable the option and configure an appropriate time limit. The available timeout options are actually quite useful and range from 1 minute (which pretty much converts a disconnect with a logoff) all the way up to 5 days (which is better than nothing I suppose, but why even bother at that point?). What option you select here largely depends on how concerned you are about resource usage and sessions being hijacked. I personally would recommend a lower end of 30 minutes up to 8 hours at the maximum.
Validating RDP settings with EventSentry Validation Scripts
EventSentry includes two validation scripts that validate whether RDP session timeouts are enabled:
Disconnected RDP sessions aren’t an immediate security risk, since they require an intruder to somehow gain admin rights on a domain member machine first. Sophisticated attacks however rarely involve just one step, but usually take advantage of multiple vulnerabilities and exploits. Since there are few to no downsides to notifying or even logging off users after a certain amount of time, I would recommend to follow the recommendations outlined in this blog post.
Just when the Microsoft Exchange exploit CVE-2021-26855 thought it would win the “Exploit of the year” award, it got unseated by the – still evolving – Log4J exploit just weeks before the end of the year!
Had somebody asked Sysadmins in November what Log4J was then I suspect that the majority would have had no idea. It seems that the biggest challenge the Log4J exploit poses for Sysadmins is simply the fact that nobody knows all the places where Log4J is being used. Most exploits affect a specific piece of software or hardware equipment, but Log4J is not a separate product, it’s just sitting somewhere on the file system of some Java application – likely among a myriad of other open source libraries.
So how do you find vulnerable instances of Log4J on a network without spending hours running scripts and manually going through software inventory? And, how do you ensure that it stays that way, and a vulnerable version of Log4J doesn’t get installed at a later point?
The answer to that question are EventSentry’s validation scripts. If you’re running EventSentry 4.2 or later, then you can utilize its validation scripts engine to discover vulnerable instances of Log4J on your monitored Windows-based systems with the latest Log4j discovery script.
As a reminder, validation scripts validate best practices across your infrastructure, and are regularly updated by EventSentry to detect insecure settings, outdated Windows systems and potential exposure to exploits.
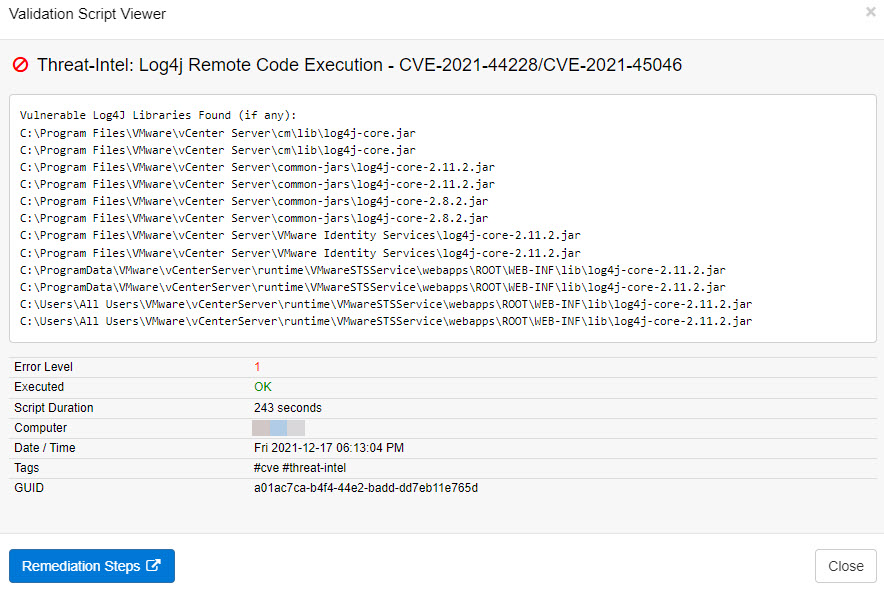
The Log4j discovery script can be assigned to any Windows-based host, and will scan the hard drive to discover all vulnerable Log4j libraries on a system. In most cases the script takes fewer than 5 minutes to run, and the results can be viewed in the Web Reports under Health -> Validation Scripts -> Status as soon as the script has finished executing. Simply filter on the script name on the Summary page or specify this query to filter the validation script results
script:"*Log4j*" AND passed:No
Please note that the speed with which the script executes may vary by host since the speed depends on the number files scanned, disk speed etc.
Since we’ve accumulated a lot of resources around EventSentry that are updated frequently, we’ve decided to launch a GitHub page where anyone can access and download scripts, configuration templates, screen backgrounds and our brand-new PowerShell module that is still under development.
We currently have 4 repositories available:
Scripts: Collection of scripts that can either be used in conjunction with EventSentry to enhance its monitoring capabilities or used independently to enhance security and automate tasks.
Configuration: Configuration templates for Ransomware and general security as well as a recommended Sysmon template.
PowerShell Module: The recently launched EventSentry PowerShell module supports the automation of a small number of EventSentry configuration tasks, such as managing hosts and groups, adding maintenance schedules and more. Note that the PowerShell module only supports a small number of tasks at this point. Feel free to request additional cmdlets via support.
Screen Backgrounds: 6 different desktop backgrounds that you should immediately apply to the desktop of your EventSentry server.
Of course we encourage collaboration, especially in the scripts and configuration repositories. Please contact us if you have any questions.