Today I have good news and bad news. You’d like to hear the good news first? OK. The bad news is that AutoAdministrator is being retired and will no longer be developed.
OK, now on to the good news. AutoAdministrator is of course not entirely history and is undergoing a similar transformation the NTToolkit did a few years back. AutoAdministrator is joining the “EventSentry” brand as the “EventSentry Admin Assistant”.
This brings the total number of software products under the EventSentry brand to three:
To celebrate this transformation we’ve made a number of improvements in the new release:
The EventSentry Admin Assistant is now available as a native 64-bit application
REG_MULTI_SZ and REG_QWORD data types are now supported (for “read” actions)
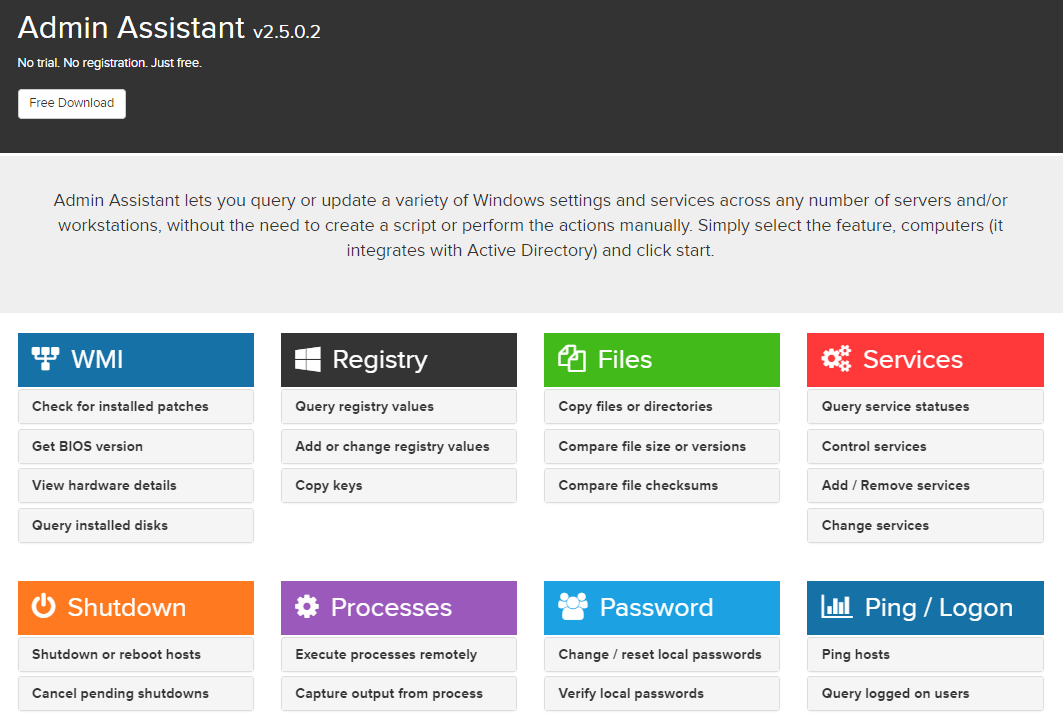
WMI queries can be filtered (aka “condition”) to allow for things like checking whether a Microsoft Windows patch is installed
The last enhancement is particularly useful if you need to check whether a particular Windows update is installed on your network – see the screenshot below.
Almost everyone in IT has heard of VNC – which actually stands for “Virtual Network Computing”. The RFB (Remote Framebuffer) protocol which VNC relies on, was developed around 1998 by Olivetti & Oracle Research Labs. Olivetti (unlike Oracle) isn’t much known outside of Italy/Europe, and the ORL was ultimately closed in 2002 after being acquired by AT&T. But enough of the history.
When the need arises to remotely log into a (Windows) host on the network, Microsoft’s Remote Desktop application (which utilizes Microsoft’s RDP protocol – not RFB) is usually the default choice. And why wouldn’t it be? It’s built into Windows, there is no additional cost, and it’s usually quite efficient (=fast) – even over slower connections.
Remote Desktop has a few disadvantages though, especially when it comes to the IT help desk:
You cannot view the remote user’s current desktop
It’s not cross-platform
You can’t use RDP if it’s disabled or misconfigured
Especially when troubleshooting user problems, being able to see exactly what the user is doing is obviously very beneficial. VNC-based applications are a good alternative since they allow you to view the user’s desktop and subsequently interact with the user. This makes VNC viable for help desk as well as troubleshooting. Nevertheless, VNC-based solutions have their own shortcomings:
Free variations of VNC usually offer no deployment assistance
With over 10 variants available, finding the best VNC implementation is a daunting task
VNC is still deemed as somewhat insecure
VNC can be slow
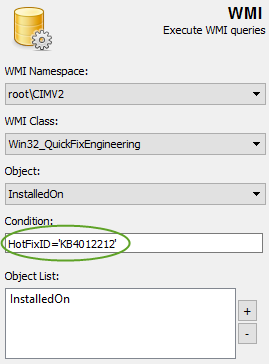
We set out to solve these shortcomings by creating a number of scripts around UltraVNC that integrate with the EventSentry management console (although they’ll work well without EventSentry as well!). Using the QuickTools feature, you can then connect to a remote host via VNC with 2 clicks, even if the remote host doesn’t have VNC installed.
Important: The scripts only work in environments where you have administrative access to the remote hosts. The scripts need to copy files to the remote host’s administrative shares and control the remote VNC service.
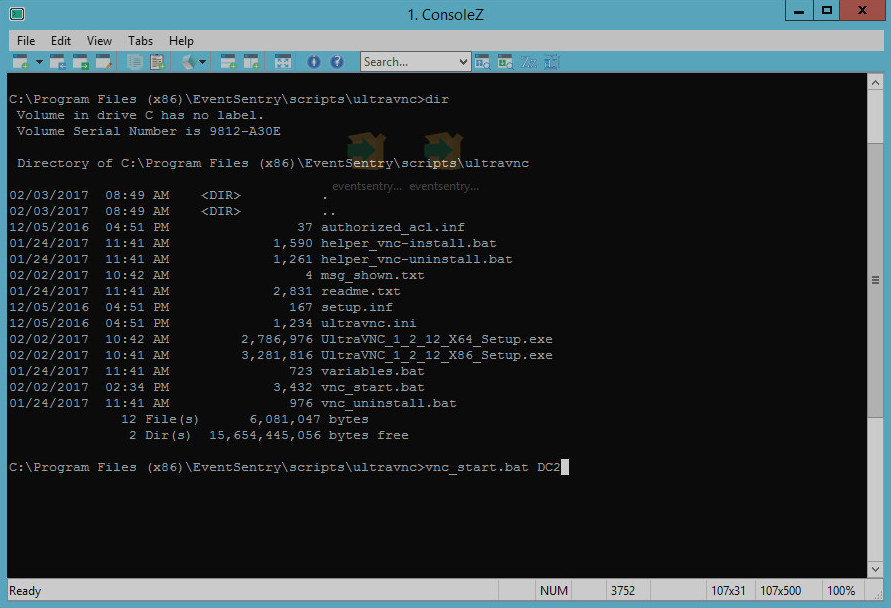
Alternatively, you will also be able to start a VNC session by running the following command:
vnc_start.bat remotehost.yourdomain.com
Even better, VNC can be automatically stopped and deactivated (until vnc_start.bat is run again) once the session is completed in order to reduce the attack surface.
VNC Deployment
As long as you have administrative access to the remote host(s), the script will remotely install VNC and even setup a firewall exclusion rule if necessary – although the UltraVNC installer takes care of this out of the box.
Security
To reduce the attack surface of machines running VNC you can automatically stop the VNC service after you have disconnected from the remote host. Our connection script will automatically start the remote service again when you connect the next time.
For the utmost security you can also completely uninstall VNC when you are done, a script (vnc_uninstall.bat) is included for this purpose.
Speed
Even though VNC is generally not as fast as RDP, it’s usually sufficiently fast in LAN environments (especially for shorter trouble-shooting sessions) and the UltraVNC port which we’ll be covering in this post performs reasonably well even over slower WAN connections.
Integration with EventSentry
Monitoring workstations with EventSentry strengthens the capabilities of any IT helpdesk and IT support team with:
Software & Hardware Inventory
Access to process utilization and log consolidation
Enhanced security with security log & service monitoring
User console logon tracking
Pro-active troubleshooting with access to performance and other system health metrics
Remote desktop sharing is an additional benefit with the UltraVNC package which is included with the latest version of EventSentry (v3.3.1.42). Customizing the scripts and integrating them with EventSentry literally shouldn’t take more than 5 minutes, and once setup & configured will allow you to remotely control any monitored host with a couple of clicks. The scripts do not require EventSentry, but are included with the setup and integrate seamlessly into the EventSentry Management Console.
The EventSentry Management Console includes the “QuickTools” feature which allows you to link up to 8 commands to the context menu of a computer item. EventSentry ships with a few default QuickTools commands, for example to reboot a remote machine. Once configured, you simply right-click a computer icon in the EventSentry Management console and select one of the pre-configured applications from the QuickTools sub menu.
EventSentry QuickTools
How does it work?
When you run the vnc_start.bat script, it will first check to see if UltraVNC is already installed on the remote host. If it is, it will skip the installation routine and bring up the local VNC viewer. If you configured the script to automatically stop the VNC service when not in use, it will start the service beforehand. When you disconnect, it will (optionally) stop the VNC service again so that VNC is not accessible remotely anymore.
If VNC is not installed, the script will remotely install & configure UltraVNC using psexec.
If you do not want to leave the UltraVNC service installed on the remote computer, the vnc_uninstall.bat script can be run when the remote session is done. Automatically stopping the remote VNC service is however sufficient in most cases.
Installation
The scripts need to be configured before they can be used in your environment, unless you are an EventSentry user, in which case you only need to download & install the prerequisites.
Super Quick Setup for EventSentry Users It’s no secret, we’re a little biased towards our EventSentry users, and as such setting this up with an existing EventSentry installation is rather easy:
Get psexec.exe and save it in C:\Program Files (x86)\EventSentry\resources.
Download the UltraVNC installers (they have 32-bit and 64-bit – download for the platforms you have on your network) and store them in the C:\Program Files (x86)\EventSentry\scripts\ultravnc folder.
Install UltraVNC on the computer where EventSentry is installed so that the VNC Viewer is available. It’s not necessary to install the whole package, only the viewer component is required.
If “VNC” is not listed in your QuickTools menu, then you will need to add it under Tools->Options->QuickTools. Simply enter “VNC” as the description and specify the path to the vnc_start utility, e.g. “C:\Program Files (x86)\EventSentry\scripts\ultravnc\vnc_start.bat $COMPUTER”. You can optionally check the “Hide” box to prevent the script output from being shown before you connect.
You’ll notice that no password was configured – that’s because you will be logging in with a Windows user and password – only allowing domain admins access by default. This can be configured in the authorized_acl.inf file, if you want to give additional groups and/or users access that are not domain admins.
That’s literally it – easy as pie. Even though we designed this thing to be easy peasy, since things do occasionally go wrong I recommend testing a first connection from the command line. Just open an administrative command prompt, navigate to C:\Program Files (x86)\EventSentry\scripts\ultravnc and type vnc_start somehost.
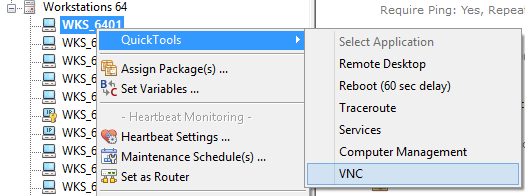
Now just right-click any host – or use the “Quicktools” button in the ribbon – and select the “VNC” menu option. Keep in mind that first-time connections will take longer since the VNC setup file has to be copied and installed on the remote computer. Subsequent connections should be faster.
VNC Viewer Connect Dialog
Manual Normal-Speed Setup for Non-EventSentry Users
So you are not an EventSentry user but still want to utilize these awesome scripts? No problem – we won’t hold it against you. The setup is still easy – you’ll just need to customize a few variables in the variables.bat file.
In variables.bat, set the VNCSETUP_X86 and VNCSETUP_X64 to the setup file names you just downloaded.
Download the PSTools and extract psexec.exe into the working directory, or a directory of your choice.
In variables.bat, point the PSEXECFILE variable to the location where you just saved psexec.exe.
Optional: Edit the authorized_acl.inf file to specify which Windows group or user will have access to VNC. You can either change the first line, or add additional lines to give additional users and/or groups permission.
Install the respective version of UltraVNC on your workstation so that the VNC Viewer is available.
Open a command line window and navigate to the folder to which VNCSOURCE points to. Test the setup by running vnc_start hostname, replacing “hostname” with an actual host name of a remote host of course.
When presented with the login screen of the VncViewer, log in with a Windows domain admin user.
That wasn’t so bad now, was it? Just remember that you’ll need to initiate any VNC session with the vnc_start.bat file. Just launching the Viewer won’t work – even if VNC is already installed on the remote machine – since the VNC service is stopped by our scripts by default. To use the folder names we created, you’ll just run
C:\Deployment\UltraVNC\vnc_start hostname
Enjoy, and happy RFBing!
Connecting to remote host
Configuration – variables.bat For the sake of completeness the variables.bat file is explained below:
VNCSETUP_X86: The file name of the 32-bit installer. This needs to only be changed whenever UltraVNC comes out with a new version. VNCSETUP_X64: The file name of the 64-bit installer. This needs to only be changed whenever UltraVNC comes out with a new version.
REMOTEINSTALLPATH: The directory where the script files will be copied to on the remote host.
VNCSOURCE: This is the folder where all the vnc-related files, including the setup executables, are located on the source host from where you initiate VNC connections – e.g. C:\Deployment\UltraVNC. VNCINSTALLDIR: The directory in which UltraVNC will be installed in (on the remote hosts).
VNCPASSWORD: This variable is not currently used since UltraVNC is automatically configured to authenticate against Windows, by default giving only Domain Admins access to VNC. This is generally more secure than using a password. You can edit the file authorized_acl.inf to give additional users and/or groups access to VNC. The file supports one ACL entry per line.
PSEXECFILE: Unfortunately we are not allowed to bundle the nifty psexec.exe file for license reasons, so you’ll have to download the PsTools and point this variable to wherever you end up copying the psexec.exe file to. If you already have psexec.exe installed then you can save yourself 2 minutes of time and just specify the path to the existing file here.
SET_VNC_SVC_TO_MANUAL: If you don’t entirely trust the security of VNC, maybe because you know what a brute force attack is, and you only want administrators to access VNC then you can set this variable to 1. As long as you only connect to the remote host(s) using the vnc_install.bat script, the scripts will ensure that the remote VNC service is started before you connect and stopped after you disconnect. Between the two of us, I’d always leave this set to 1 unless you have the desire to launch the VNC Viewer directly, or need non-administrators to be able to connect to the remote host(s).
ADD_FIREWALL_RULE: As the name (almost) implies, this will create a firewall exclusion rule on the remote host(s) if you’ve been doing your homework and enabled the Windows firewall. If you don’t like our boring firewall rule name then you can even change the name below by editing the FW_RULE_NAME variable. Enabling this is usually not necessary since the UltraVNC setup adds firewall exclusion rules by default.
VNCVIEWER: If you find that a different version of the VNC viewer works better than the version which we are shipping, then you can change the file name here.
In my previous post I talked about our new NetFlow component as well as the new agent management capabilities now available in EventSentry v3.3. In this post I’ll cover the remaining new features and improvements we’ve made in v3.3, starting with the web reports.
Web Reports
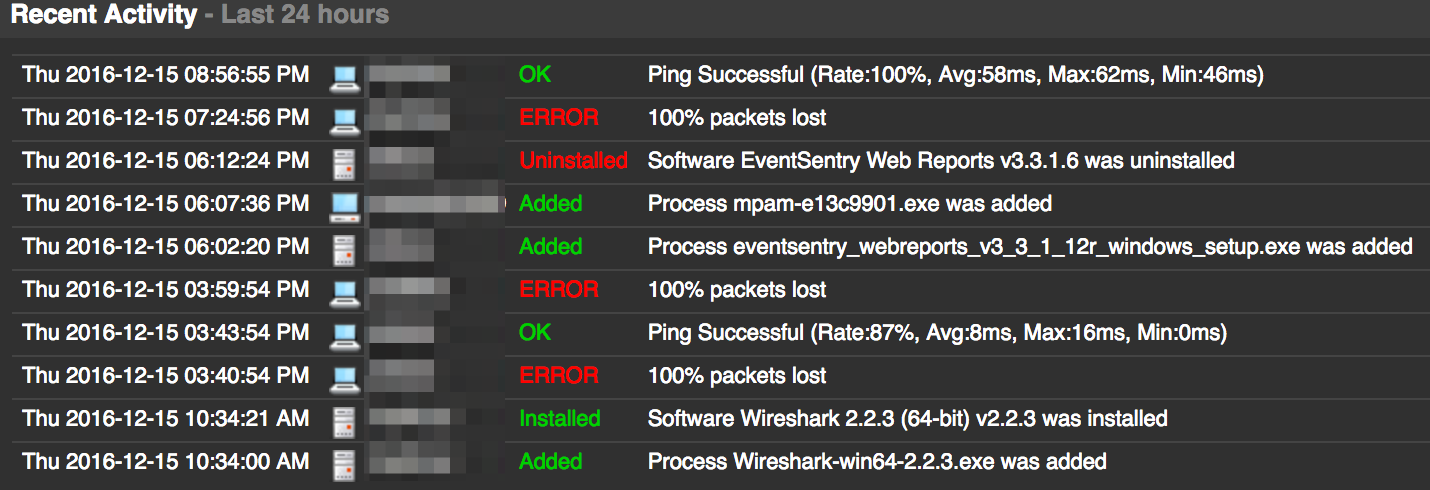
There are a number of new features and improvements in addition to NetFlow visualization. There are a few new dashboard tiles, including a “Recent Activity” tile which – as the name implies – shows recent relevant changes such as newly detected processes, software (un)installed, ping status or service status changes.
Viewing recent activity on the dashboard
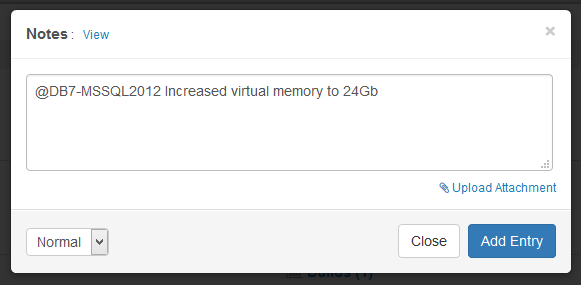
Anybody who works in a team of two or more Sysadmins should find the new notes feature incredibly helpful. It lets any web reports user add comments (=notes) which are subsequently visible to others. Notes can be associated with one or more hosts (ensuring they show up in the “Documentation” tab of the respective host status page) and can include documents as attachments as well! Do you have warranty documents or network diagrams you want to store in a central place – easily accessible? That’s what the notes are for.
Adding a note to the web reports
The overall look and feel has also been refreshed, and we’ve reorganized the menu to make it faster to access dashboards and easier to find pages.
The visualization of data has been improved, since some chart types work better with certain features of EventSentry. You can now visualize grouped data using either pie charts, tree maps or column charts.
The security of the web reports has also improved with a lockout policy which will locking an account after too many unsuccessful logon events.
Monitoring Improvements
As mentioned in part 1, the EventSentry is agent is now available in 64-bit, making it possible to monitor 64-bit counters and easier to monitor files in 64-bit directories. For users upgrading from an earlier version, the EventSentry management console will automatically migrate any existing 32-bit agents on 64-bit versions of Windows.
Application & Services Event Logs
While monitoring Application & Services event logs, often referred to as “custom” event logs was possible, the way this needed to be configured in the management console was a common source of confusion. Some users also needed the ability to monitor more than 30 different logs. Consequently, monitoring additional event logs is now straightforward, and users can monitor as many event logs as they wish.
Filter Chaining
With thresholds, timers, schedules, insertion strings, EventSentry already offers a sophisticated engine for monitoring events in real time. New in this release is the ability to setup filter chaining. This makes it possible to trigger actions only when 2 or more events occur, and you can even link events together using insertion strings. Chaining is enabled on the package level, and every filter in a “chaining” package is automatically part of the filter chaining rules.
Event Annotation
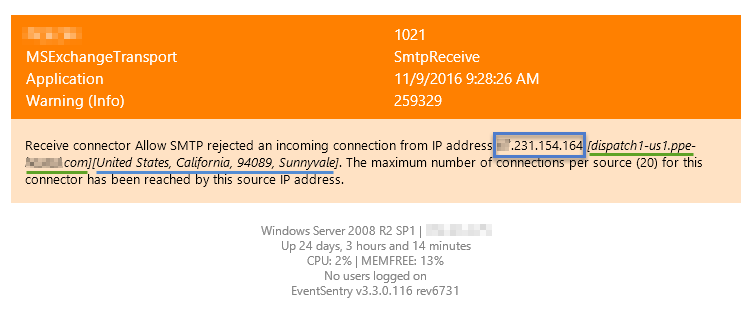
It happens frequently that we get alerts that require us to do additional research based on the information provided in the alert. For example, we may get an alert about an IP address for which we then need to do a reverse lookup or find the geoip location. Audit Success & Failure events from the security event log are another example, and often contain error codes and numbers which are not explained.
Green line shows reverse lookup, blue line geo location
We set out to improve upon this, and starting with v3.3 EventSentry will annotate email alerts in a number of ways whenever possible:
IP addresses will include a reverse lookup
IP addresses will include a geoip location
Security events will have various error codes resolved
Please note that (1) and (2) are only supported for emails sent through the collector since it requires access to a local geoip database. (1) and (2) will need to be enabled in the email action “Options”, (3) is automatically enabled for all emails.
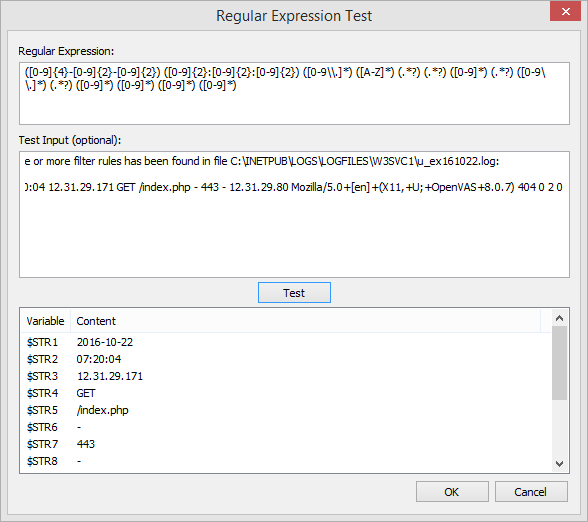
Insertion Strings & Regex
By making insertion strings from events accessible in filters and actions (e.g. through the $STR1, $STR2, … variables), it’s possible to create highly granular thresholds, customize emails, easily trigger corrective actions which utilize content from events and more. Based on our own requirements we took this capability a step further however, and you can now apply regex filters to events to define your own insertion strings. This is particularly useful for alerts which don’t use insertion strings or for events which contain log data. For those types of events, you can now parse parts of log strings and assign them to insertion strings. The previous blog article, Detecting Web Server Scan in Real-Time, shows a practical example of how to apply this new feature. It does require you to be a bit familiar with Regular Expressions, but the management console includes a handy dialog where you can test your regular expressions, shown below.
Regex preview & test utility in management console
Performance
Faster is better! We’ve improved performance in a number of areas:
The database insert performance of the Syslog daemon has been improved for Microsoft SQL Server databases
The delimited log file feature now includes an additional index to increase database insert performance
The heartbeat agent now relies less on RPC-based agent status monitoring and can instead obtain the status of a remote agent either directly from the collector or the database, resulting in less network traffic and faster heartbeat monitoring cycles.
With new features & improvements in a variety of areas, this release should contain improvements for everyone. Remember that you can also submit feature requests here.
We are very excited to release EventSentry v3.3, a major update to our award-winning monitoring solution EventSentry, less than 10 months after the release of the previous major version 3.2. Version 3.2 included the collector component which supports secure and reliable communication with remote agents as well as better database throughput, switch port mapping and many improvements to the web reports.
I’d like to also thank everyone who took the time to fill out our annual survey – we read every single response in detail. If you haven’t taken it yet then you can still do so here.
The v3.3 release, which builds upon some of the architectural changes we have made in v3.2, and offers new functionality to help you:
Visualize, measure & investigate network traffic better with the new NetFlow component – with discounted introductory pricing until 12/31 2016!
Spend less time managing agents – the collector can now push configuration as well as agent updates automagically – think laptops!
Deployment via MSI is much easier – MSI file creation now only takes a few seconds
Investigate issues faster with email alerts which have geo location, reverse lookups as well complex security codes included inline
Visualize any data in the web reports more easily with additional dashboard tiles and treemaps throughout
Managing and using custom event logs is now more straightforward and scalable
Database throughput has been improved for Syslog data and delimited log files
Even more advanced filtering is possible with filter chaining and insertion string override via regular expressions
Communicating and documenting your network has just become a lot easier – add notes and/or upload documents in the web reports
Monitor 64-bit operating systems with a native 64-bit agent
With a brand new component and many new features in a variety of areas, v3.3 will have something of interest for everyone. Let’s dive in and look at the new features in more detail.
NetFlow NetFlow is a new component which is part of the “Network Services” service (along with Syslog, SNMP, ARP) and is licensed separately. Pricing is very competitive and an additional introductory discount will be available until the end of this year, 12/31 – including competitive upgrades. You can request a quote here.
Collecting NetFlow data allows you to see all traffic meta data which passes through network devices that support NetFlow, including:
Source IP, destination IP
Source host, destination IP (when resolvable)
Source port, destination port
Geo location (when available)
IP protocol used
Amount of traffic sent and received
Number of packets transmitted
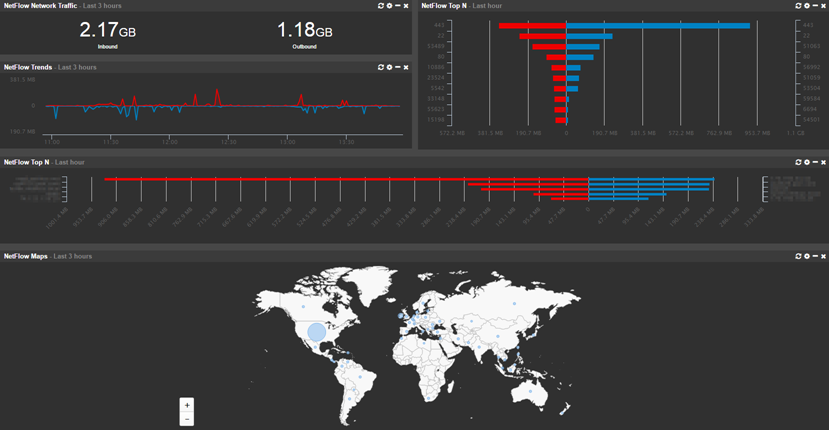
Dashboard for NetFlow
EventSentry v3.3 currently supports the NetFlow v1, v5, v9 as well as sFlow flow protocols. NetFlow is usually supported by most commercial routers and firewalls whereas sFlow is most commonly supported by switches. NetFlow is generally preferable over sFlow – especially for forensic analysis since sFlow samples traffic and only sends every nth flow. sFlow can be preferable when dealing with large amounts of data, but EventSentry’s NetFlow implementation (as well as NetFlow itself) has a way to group flows and therefor condense traffic.
Do you need NetFlow, and is it worth looking into? Without NetFlow there is impossible to know which hosts communicate with each other (unless you capture network traffic). What traffic enters the network, and what traffic leaves it? Broadly speaking, implementing NetFlow lets you:
Visualize all network traffic in a variety of ways and reports
Analyze network data for forensic purposes
Utilize network traffic data for troubleshooting purposes
Map network traffic to geo location
Correlate network traffic with Active Directory users (requires workstation monitoring)
Measure bandwidth utilization
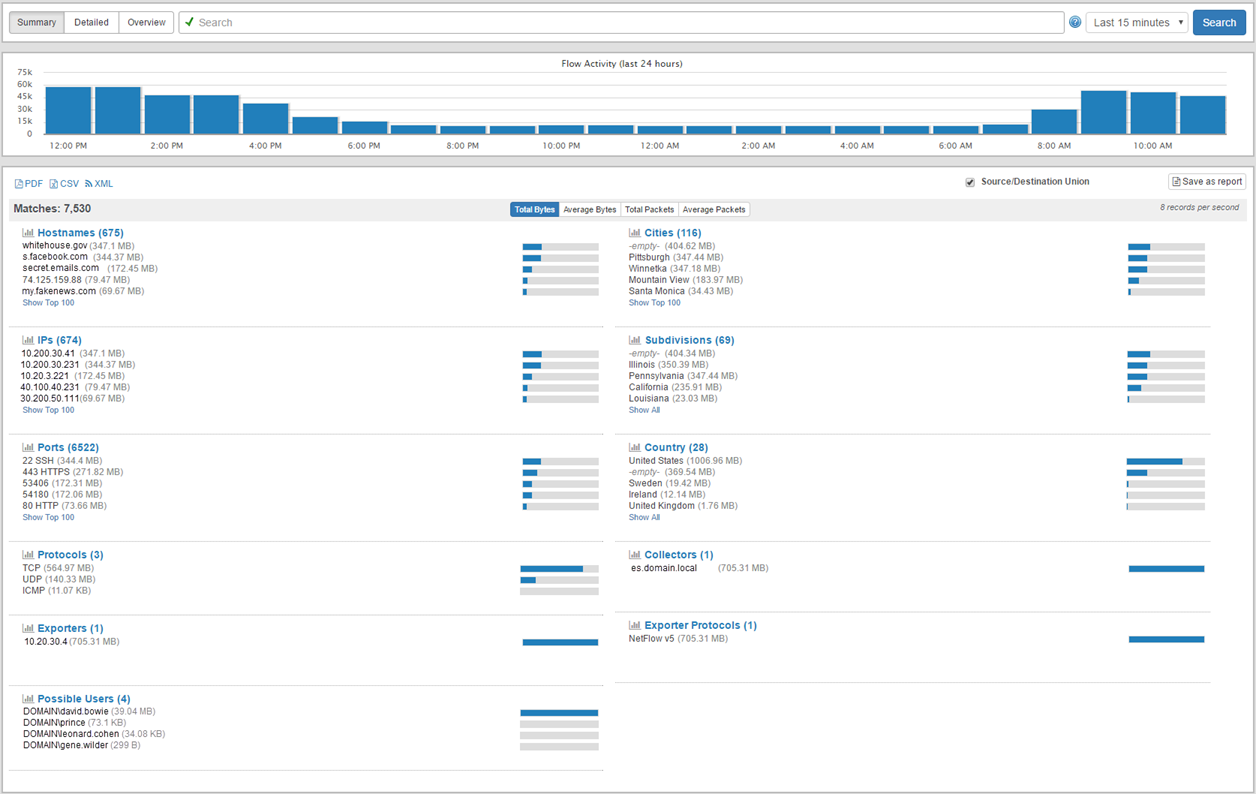
NetFlow Summary
On the EventSentry side, setting up NetFlow should take less than 5 minutes; and setting it up on the network device side is generally just a matter of enabling NetFlow and pointing it to EventSentry.
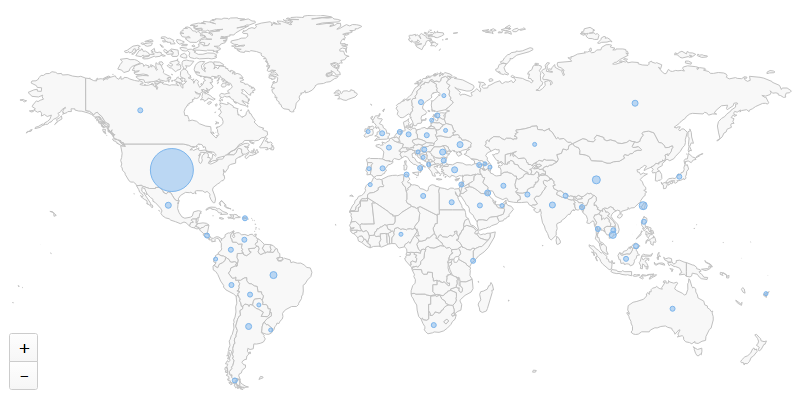
Geo Location
EventSentry ships with the GeoLite geo database from MaxMind which does a good job of associating IP addresses with physical locations down to the city level. If you are looking for more accuracy however, then you can also purchase the full geo location database from MaxMind here.
Blocked ports by origin country
Active Directory User Correlation
A unique feature of EventSentry’s NetFlow implementation is the ability to correlate workstation logins with network traffic, making it possible to associate network traffic with individual users. This requires that workstations are monitored with EventSentry and works best when users have a dedicated workstation.
Agent Management & Deployment
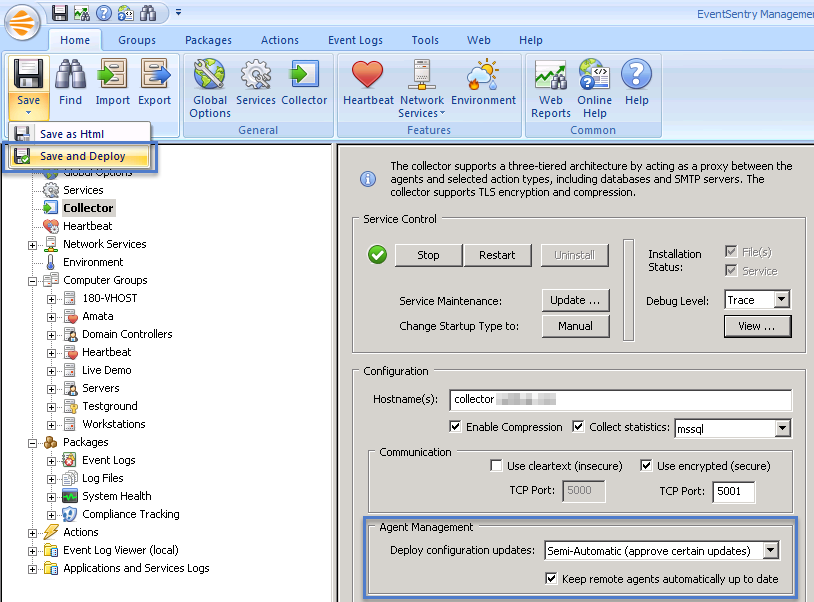
If you are utilizing the collector service then you have now a great time-saving feature available. Pushing a configuration update to remote hosts after you made a change or deploying agent updates after a patch installation are a thing of the past once you activate the respective options in the collector dialog.
Managing automatic configuration updates can be done in 2 ways: Either by automatically deploying a configuration update after you click “save”, or by deploying only approved configuration updates (recommended). If you select the latter, then you just have to click the new “Save & Deploy” sub-option on the ribbon and the collector will do the rest. It’s no longer necessary that the EventSentry agent is directly reachable from the management console; it will receive the latest configuration as soon as it connects to the collector.
Configuring Agent Management
Please note that you will still need to manually deploy a v3.3 agent once in order for automatic agent updates to work, since the self-update code is embedded in the new agents.
Creating MSI files has also been greatly simplified – a x86 and x64 agent MSI file is created with just a few mouse button clicks. Manually editing MSI files with tools like ORCA is a thing of the past. The only prerequisite is the (free) WiX Toolset which has to be installed only once.
Monitoring Laptops
In addition to saving most EventSentry users a lot of time, these new deployment features also make it possible to monitor laptops which aren’t permanently connected to the network. Simply deploy the agent MSI file with your favorite deployment tool (or deploy with the management console) and enable the configuration and agent management options in the collector. From that point on, any agent connecting to the collector will automatically receive the latest configuration AND any new agent updates – completely automatically – no matter where in the world they are located.
64-Bit Agents
EventSentry v3.3 now ships with both a x86 and x64 agent, so that 64-bit editions of Windows can be monitored natively. The key benefit of this change is that 64-bit only performance counters can now be monitored, these counters were off limit with 32-bit agents. Utilizing 64-bit agents also results in the following changes:
Agents will be automatically converted to 64-bit when v3.3 is deployed. It is not possible to use a 32-bit v3.3 agent on a 64-bit version of Windows
File system redirection via “Sysnative” or in the File Checksum Monitoring packages is no longer necessary
Memory consumption will be slightly higher compared with 32-bit agents
Please note that EventSentry has not completely migrated to 64-bit yet, some components (management console, heartbeat agent, web reports) are still shipped as 32 bit executables. We plan on migrating all components to 64-bit by the end of 2017.
There are just too many new features in v3.3 to fit them all into one blog post, so stay tuned for part 2 which will follow shortly.
Since Ransomware is still all the rage – literally – I decided to write a 4th article with a potentially better method to stop an ongoing infection. In part 1, part 2 and part 3 we focused mostly on detecting an ongoing Ransomware infection and utilized the “nuclear” option to prevent it from spreading: stopping the “server” service which would prevent any client from accessing files on the affected server.
While these methods are certainly effective, there are other more targeted steps you can take instead of or in addition to shutting down the server service, provided that all hosts susceptible to a Ransomware infection are monitored by EventSentry.
When EventSentry detects an ongoing Ransomware infection, it can usually determine the infected user by extracting the domain user name from the 4663 event. Simply disabling the user is insufficient however, since a disabled user can continue to access the network (and wreak havoc) as long as he or she doesn’t log off. Any subsequent log on attempt would of course fail, but that provides little comfort when the user’s computer continues to plow through hundreds or thousands of documents, relentlessly encrypting everything in its path.
As such, the only reliable way to stop the ongoing infection, given only the user name, is to log off the user. While logging a user off remotely is possible using the query session and logoff.exe commands, I prefer to completely shut down the offending computer in order to reduce the risk of any future malicious activity. Logging the user off remotely may still be preferable in a terminal server environment (let me know if you want me to cover this in a future article).
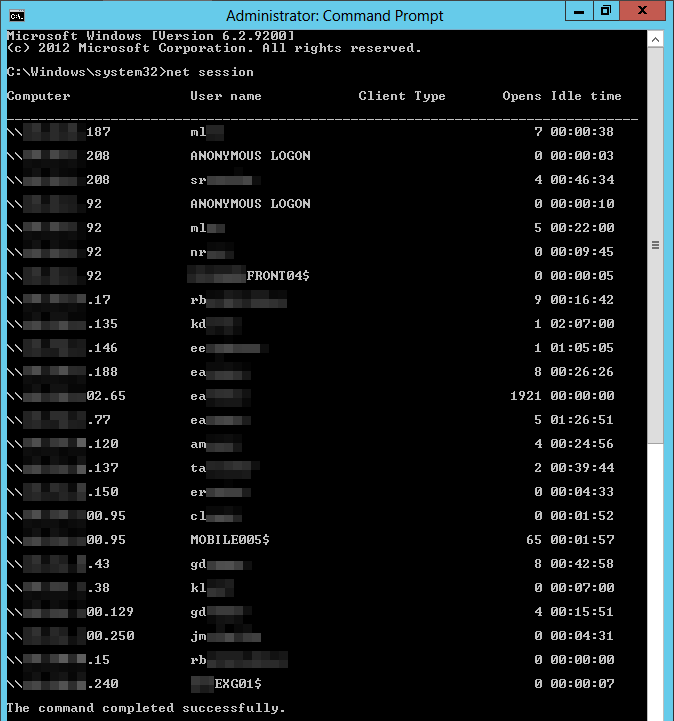
Knowing the user name is of course great, but how do we find out which computer he or she is logged on to? If you have EventSentry deployed across your entire network – including workstations – then you can get this info by querying the console logon reports in the EventSentry web reports. If you are not so lucky to have EventSentry deployed in your entire environment (we offer significant discounts for large quantities of workstation licenses – you can request a quote here) then we can still obtain this information from the “net session” command in Windows.
Net Session Output
We’ve created a little script named antiransom_shutdown.vbs which, given a user name, will report back from which remote IP this user most recently accessed the local server and optionally shut it down. Here are some usage examples:
Find out from which computer boris.johnson most recently accessed this server: cscript.exe C:\Scripts\antiransom_shutdown.vbs boris.johnson
Find out from which computer boris.johnson most recently accessed this server AND shut the remote host down (if found): cscript.exe C:\Scripts\antiransom_shutdown.vbs boris.johnson shutdown
The script uses only built-in Windows commands, as such there is no need to install anything else on the server where it’s run.
When executed with the “shutdown” parameter, the script will issue a shutdown command to the remote host, which will display a (customizable) warning message to the user indicating that the computer is being shutdown because of a potential infection. The timeout is 5 seconds by default but can be customized in the script. It’s recommended to keep the timeout short (5-10 seconds) in order to neutralize the threat as quickly as possible while still giving the user a few moments to know what is happening.
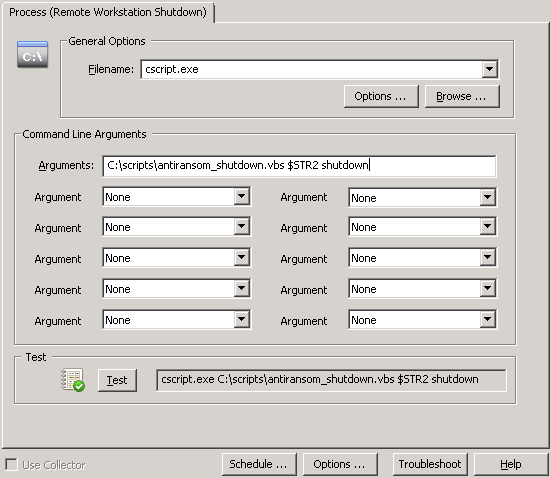
The overall setup of the Ransomware detection is still the same, we’re setting up a threshold filter to detect a higher than usual frequency of certain 4663 events and trigger an action in response. Only this time we don’t shut down the server service, but instead trigger this script. To properly execute the action, configure it as shown in the screenshot below. The executable is cscript.exe (the interpreter for .vbs files) and the command line parameters are the name of the script, $STR2 and “shutdown”.
Remote workstation shut down
So what’s the better and safer approach to freeze an ongoing Ransomware infection? Shutting down the server service is the most reliable approach – since it doesn’t require the workstation to be reachable and will almost certainly succeed. Remotely shutting down a workstation has minimal impact on operations but may not always succeed. See below for the pros and cons of each approach:
File Sharing Shutdown Pros: 100% effective Cons: Potentially larger disruption than necessary, false positive unnecessarily disrupts business
Remote Workstation Shutdown Pros: Only disables infected user/workstation, even if false positive Cons: Requires workstation to be reachable
This ends up being one of those “it depends” situations where you will have to decide what’s the best approach based on your environment. I would personally go with the remote workstation shutdown option in large networks where the vast majority of workstations are desktops reachable (and not firewalled) from the file server. In smaller, more distributed networks with a lot of laptops, I would go with the file service shutdown “nuclear” option.
A hybrid approach may also be an option for those opting for the remote workstation shutdown method: trigger a remote workstation shutdown during business hours when IT staff is available on short notice, but configure the file service shutdown after business hours when it’s safer and affects fewer people. All this can be configured in EventSentry by creating two filters which are identical except for the action and the day/time settings.
Prerequisites It’s important to point out that the EventSentry agent by default runs under the LocalSystem account, a built-in user account which does not have sufficient privileges on a remote host to issue the shutdown command. You can elevate the permissions of the EventSentry agent and work-around this limitation in 2 ways:
Change the service account (fast): Changing the service account the EventSentry service uses to a domain account with administrative permissions will allow the agent to remotely shut down a remote host. This will have to be done on every file server which may issue shut down commands (you can use AutoAdministrator to update multiple file servers if necessary).
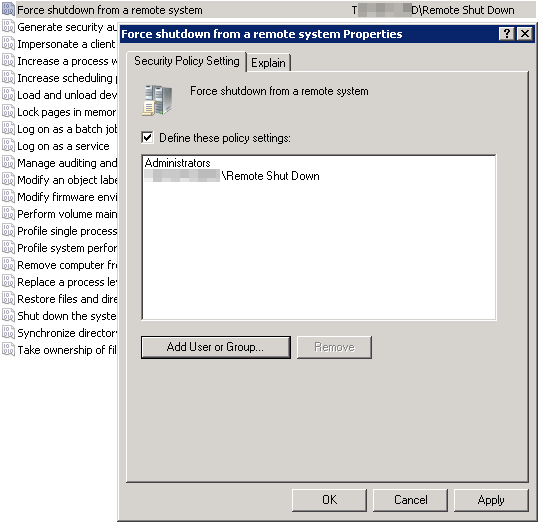
Give the “Force shutdown from a remote system” user right: It’s not necessary to issue domain-wide admin rights to the EventSentry agent, the key right the agent needs is just the “Force shutdown from a remote system” user right. The quickest way to deploy this setting is of course through group policy:a) Open the “Group Policy Management Editor”
b) Edit an existing policy (e.g. “Default Domain Policy”) or create a new group policy
c) Navigate to “Computer Configuration\Policies\Windows Settings\Security Settings\Local Policies\User Rights Assignment”
d) Double-click the “Force shutdown from a remote system” user right and add both “Administrators” and the computer accounts of the file servers to the list. Alternatively you can also create a group, add the file servers to the group, and add that group to the policy (keep in mind that you will need to restart the file servers if you go with the group method).
Once the group policy setting has propagated to the workstations, the remote shut down initiated from the file server(s) should succeed.
Change the “Force shutdown from a remote system” user right
Good luck protecting your network against Ransomware infections, also remember to verify your backups – no protection is 100% effective.