Just when the Microsoft Exchange exploit CVE-2021-26855 thought it would win the “Exploit of the year” award, it got unseated by the – still evolving – Log4J exploit just weeks before the end of the year!
Had somebody asked Sysadmins in November what Log4J was then I suspect that the majority would have had no idea. It seems that the biggest challenge the Log4J exploit poses for Sysadmins is simply the fact that nobody knows all the places where Log4J is being used. Most exploits affect a specific piece of software or hardware equipment, but Log4J is not a separate product, it’s just sitting somewhere on the file system of some Java application – likely among a myriad of other open source libraries.
So how do you find vulnerable instances of Log4J on a network without spending hours running scripts and manually going through software inventory? And, how do you ensure that it stays that way, and a vulnerable version of Log4J doesn’t get installed at a later point?
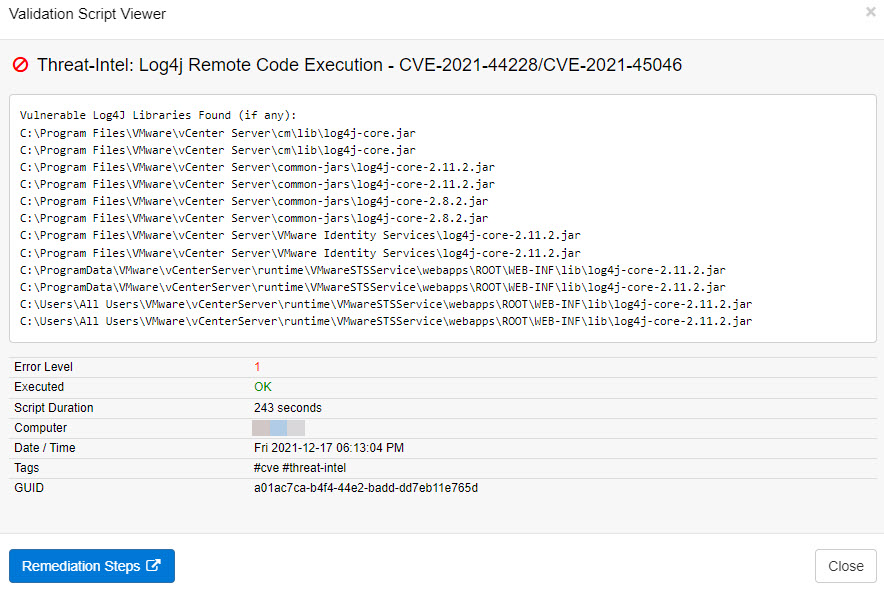
The answer to that question are EventSentry’s validation scripts. If you’re running EventSentry 4.2 or later, then you can utilize its validation scripts engine to discover vulnerable instances of Log4J on your monitored Windows-based systems with the latest Log4j discovery script.
As a reminder, validation scripts validate best practices across your infrastructure, and are regularly updated by EventSentry to detect insecure settings, outdated Windows systems and potential exposure to exploits.
The Log4j discovery script can be assigned to any Windows-based host, and will scan the hard drive to discover all vulnerable Log4j libraries on a system. In most cases the script takes fewer than 5 minutes to run, and the results can be viewed in the Web Reports under Health -> Validation Scripts -> Status as soon as the script has finished executing. Simply filter on the script name on the Summary page or specify this query to filter the validation script results
script:"*Log4j*" AND passed:No
Please note that the speed with which the script executes may vary by host since the speed depends on the number files scanned, disk speed etc.
Since we’ve accumulated a lot of resources around EventSentry that are updated frequently, we’ve decided to launch a GitHub page where anyone can access and download scripts, configuration templates, screen backgrounds and our brand-new PowerShell module that is still under development.
We currently have 4 repositories available:
Scripts: Collection of scripts that can either be used in conjunction with EventSentry to enhance its monitoring capabilities or used independently to enhance security and automate tasks.
Configuration: Configuration templates for Ransomware and general security as well as a recommended Sysmon template.
PowerShell Module: The recently launched EventSentry PowerShell module supports the automation of a small number of EventSentry configuration tasks, such as managing hosts and groups, adding maintenance schedules and more. Note that the PowerShell module only supports a small number of tasks at this point. Feel free to request additional cmdlets via support.
Screen Backgrounds: 6 different desktop backgrounds that you should immediately apply to the desktop of your EventSentry server.
Of course we encourage collaboration, especially in the scripts and configuration repositories. Please contact us if you have any questions.
Anybody who’s looked for answers on the Internet has likely stumbled across a “TOP X LISTS”: The “10 things famous people do every day”, “Top 10 stocks to buy”, the “20 books you have to read” are just some examples of the myriad of lists that are out there offering answers. You may have even stumbled upon a few “Top 10 (or 12) Events To Monitor” articles too.
Why We Love Top 10 Lists and 10 Reasons Why We Love Making Lists provide some insight as to why these types of articles keep popping up all over the place for just about any topic. And it makes sense when you think about it! You’re facing a new problem/challenge you presumably know little about, get a “Hey, just do these 10 things!” list back and: Done.
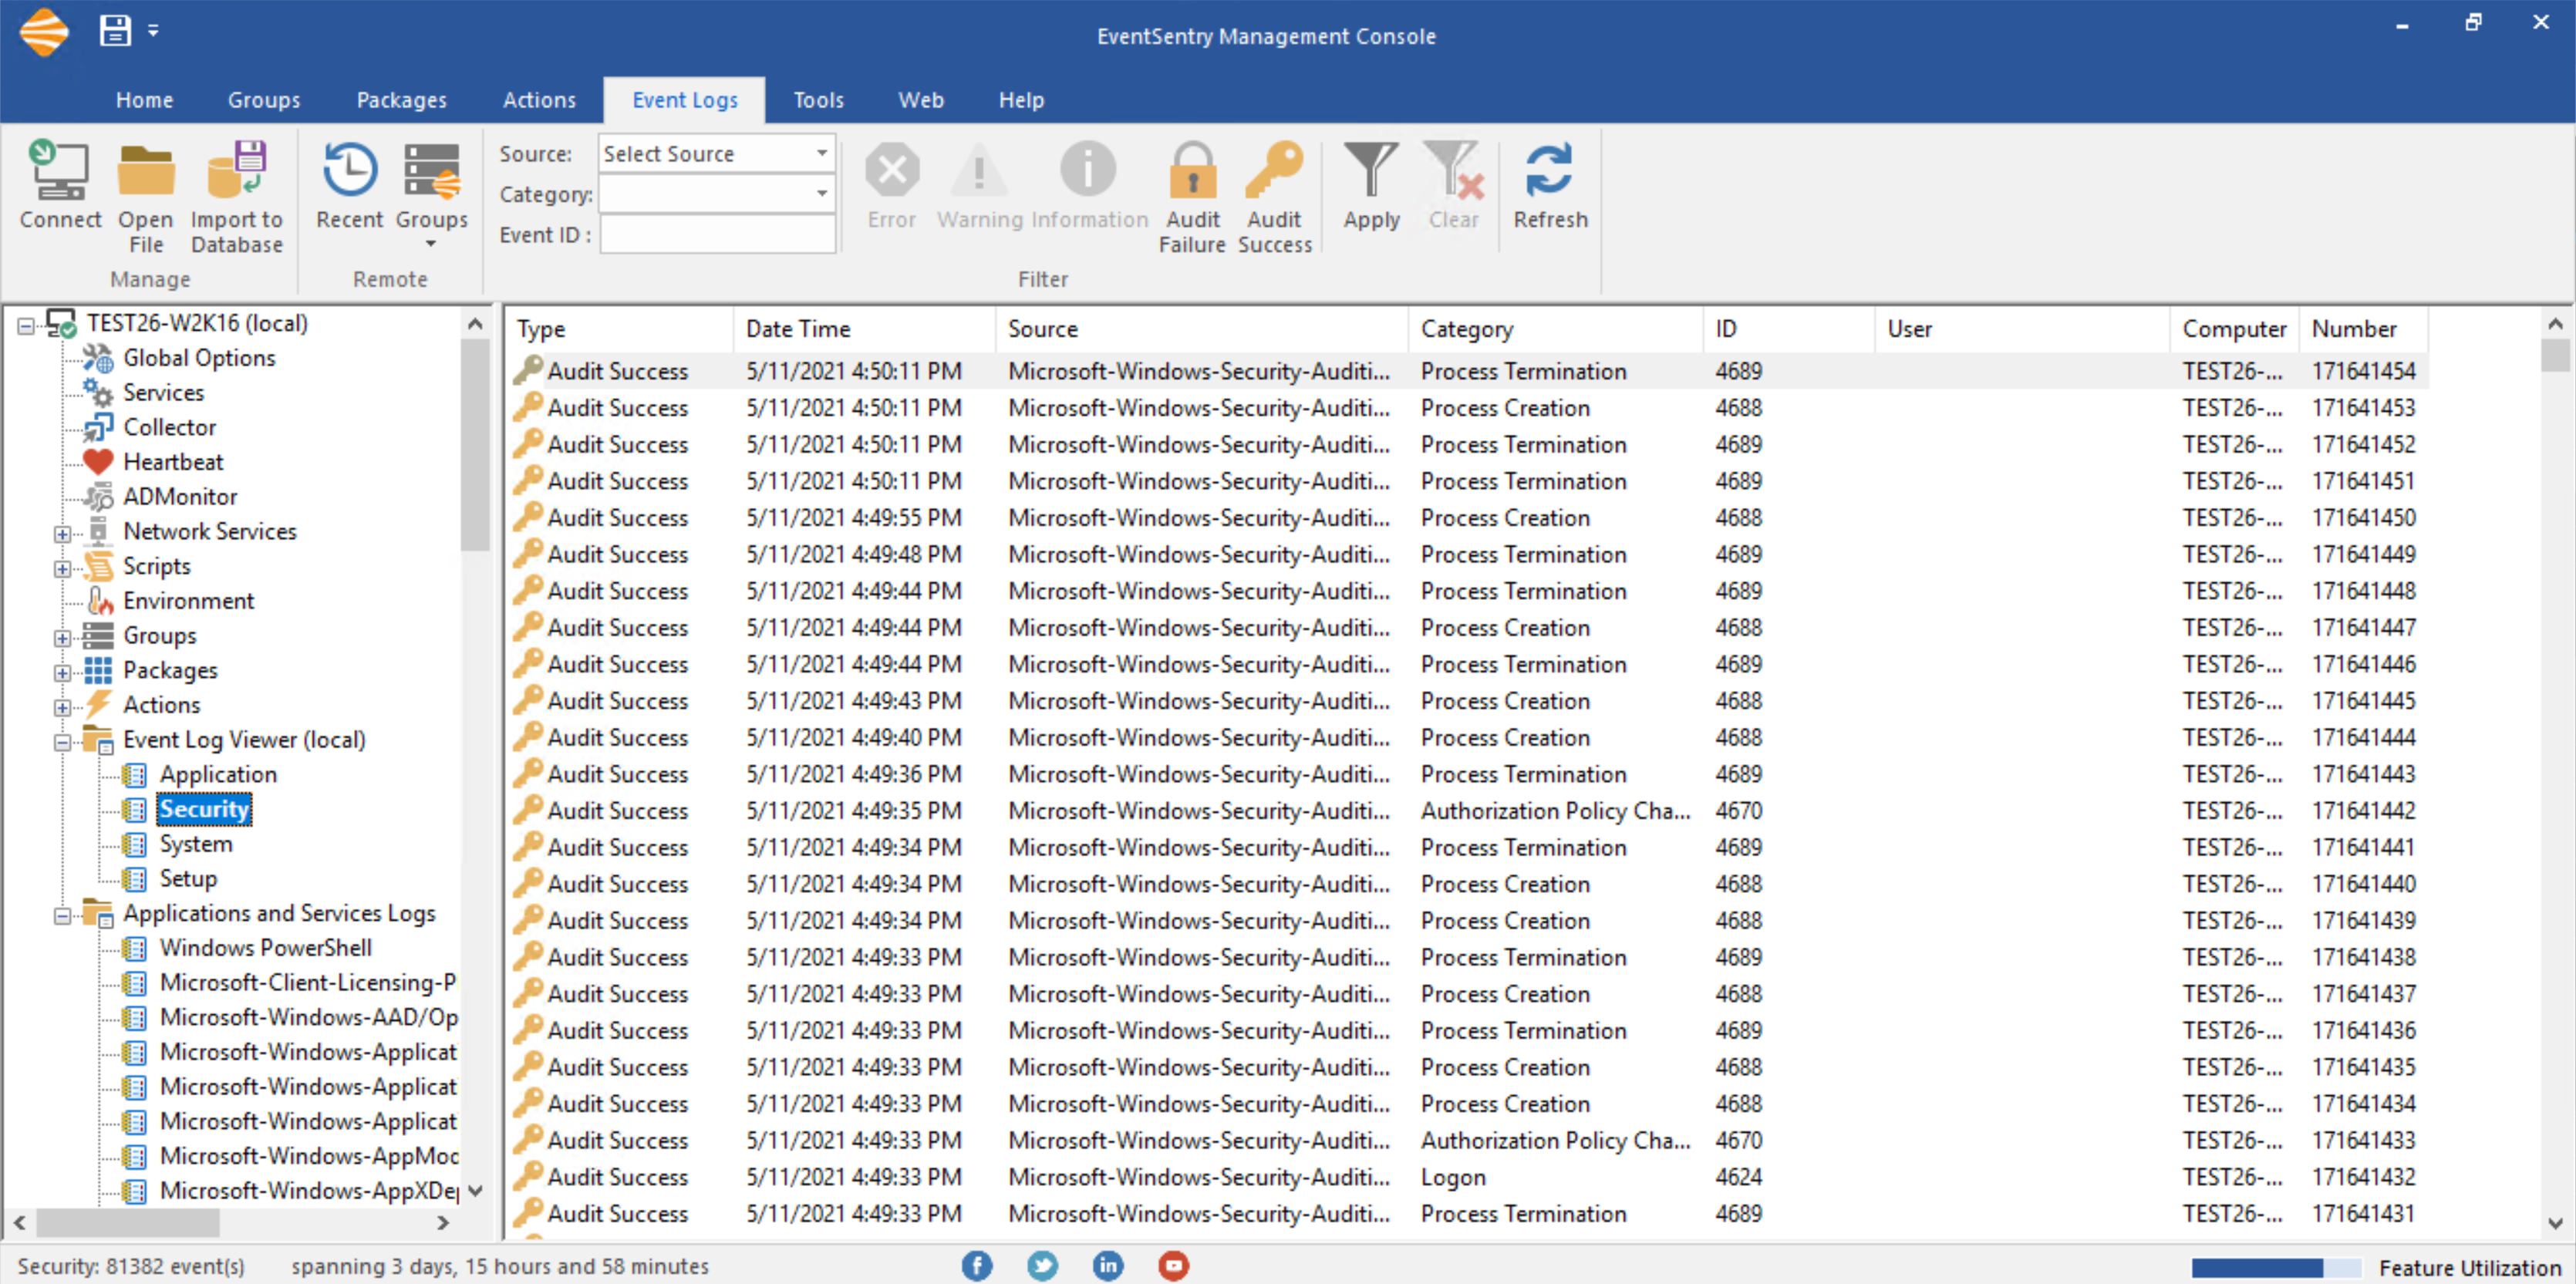
But while “Top 10” lists are surely useful for a variety of topics (“Top 10 Causes of House Fires“), they are less useful when it comes to identifying event IDs to monitor. Why? Because auditing 10, 20 or even 30 events is just not enough to detect suspicious activity or help with forensics. Just consider that Windows 2019 potentially logs over 400 different events to the event logs – almost 3 x as many as Windows Server 2003 did. Sure, in practice Windows 2019 likely only logs some of these 400 events, but even a minimalist would probably agree that monitoring fewer than 10% of all events is probably not going to give you a whole lot of visibility into your network.
But before we go any further, let’s distinguish between auditing and monitoring. Enabling auditing tells a system to constantly create a trail of activity that can later be analyzed – either manually or by software. Monitoring on the other hand means that you’re actually doing something with those events – whether that’s storing them in a different location, analyzing them or getting email alerts.
But enabling auditing (correctly) is always the first step that any subsequent process builds on. And, enabling auditing is not only free but generally doesn’t impact system performance either (the only exception are large event logs that can affect memory usage).
Yet the sad reality is that many organizations out there are still not properly auditing their Windows servers. A system that’s not auditing its activity gives you neither the ability to respond to important events, nor does it let anyone retrace the steps of attackers after an intrusion has occurred (forensics). So let’s repeat: Regardless of whether you have a monitoring solution in place or not, or are planning on getting one, auditing should always be on and needs to be the first thing you do.
Auditing alone is, of course, no longer sufficient to maintain a secure network, and not only because clearing your event logs is one of the first thing intruders do after they attack. As the developers of EventSentry we’re obviously a little biased, but with proper event log monitoring in place, you can:
Store events in a secure location, safe from tampering & deletion
Correlate events across multiple hosts
Receive real-time alerts for critical events
Detect suspicious behavior
and more. So, whether you’re in charge of a grocery store in Idaho, a government contractor in Virginia or in charge of distributing oil for the Eastern U.S., the events below should always be monitored:
Now, going all out and monitoring 85 events as the baseline may seem crazy and overkill – after all you’ve never seen a “Eat these 85 foods to be healthy” list – but let’s remember the 4 reasons you should monitor these events:
You can never retroactively enable auditing. More is better.
Most of these 85 events log events infrequently.
Attackers don’t want you to enable auditing.
The Internet is crazy.
And just when you think you’re good, one needs to point out that even auditing these 85 events is not sufficient if you have to be compliant with regulations like CMMC, PCI and others (if you need to be compliant then I recommend our free validator here). And here are 3 great reasons those events are a good baseline:
They document changes made to the OS (e.g. scheduled task added)
They report a security issue (e.g. group membership changed)
They are logged infrequently and thus won’t spam your event log(s)
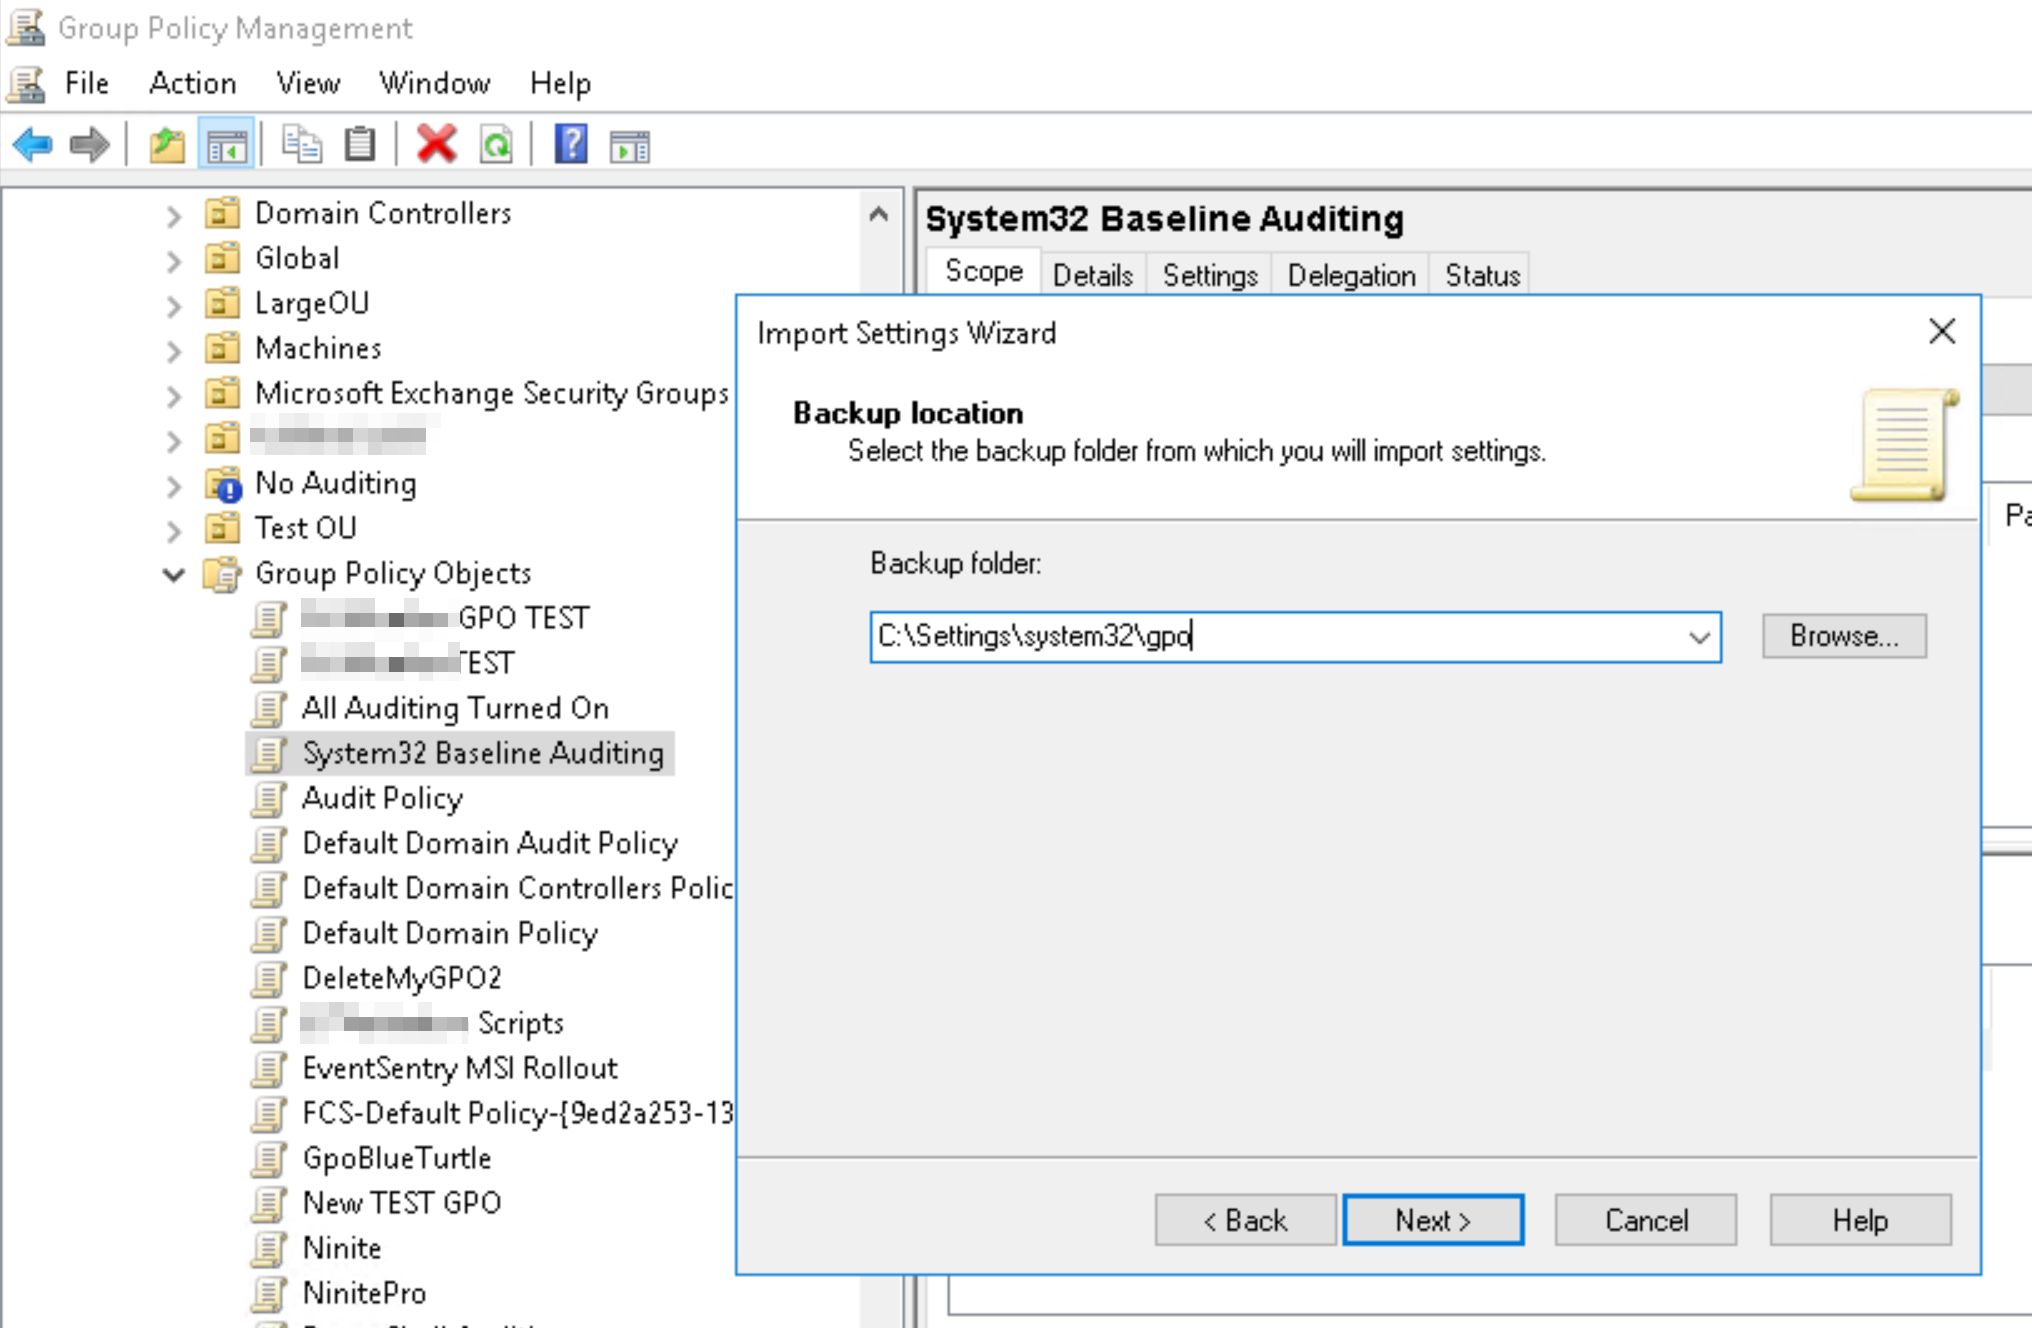
To activate these audit settings, either run the auditpol commands at the bottom of the list on all hosts or, a much better option, setup a group policy that will ensure these settings are always enforced across the entire domain/forest. The linked page includes instructions on how to import the necessary audit settings into a GPO, but here they are just in case:
Open the “Group Policy Management” application
Navigate to the “Group Policy Objects” container of the applicable domain
Right-click the container and add a new GPO object with a descriptive name (e.g. “Mandatory Auditing”)
Right-click the newly created GPO object and select “Import Settings”
Proceed with the wizard and point the “Backup Folder” path to the folder where the zip file was extracted to
The GPO object will now contain all audit policies for all events listed above
Link the GPO to the domain or select OUs
Larger networks may require different audit settings depending on server role, location and security level which may result in more complicated group policies. Remember that EventSentry can keep track of your audit policies to make sure your policies are accurate.
This latest update to EventSentry improves your security posture with validation scripts, simplifies IT troubleshooting for both administrators and users, gives you visibility into installed browser extensions along with many other usability improvements in the web reports.
Validation Scripts
Proactively identifying (potentially) malicious behavior is the cornerstone of any security defense, and a key feature of log management / SIEM solutions. But many security violations are the direct consequence of incorrect or missing settings on endpoints.
Traditional log management solutions may show you when something is happening that shouldn’t be happening, yes. But wouldn’t it be better to assess key OS components and security settings on a regular basis, and identify known weaknesses?
Consider a motion-triggered camera that will let you know when somebody is snooping around your property at 3AM in the morning. That camera is extremely important, and the foundation of any serious property security system – without it, you wouldn’t even know what was going on!
But wouldn’t it be even better if somebody was inspecting your windows, fence and locks on a regular basis, to let you know if a door or window was unlocked, or an insecure lock was being used at one of the entrances? If your overall perimeter was more secure in the first place, there would be fewer potential intrusion attempts.
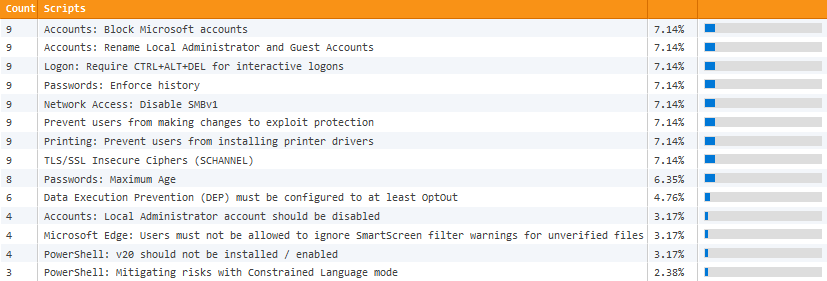
And that’s exactly what EventSentry’s 60+ validation scripts do. Our managed security & health checks continuously compare critical settings on your monitored hosts with our baseline, immediately indicating potential risks. These checks identify a wide variety of potential risks, such as:
A Windows server/workstation is not on the latest patch
Windows firewall is disabled
No A/V software installed
Insecure TLS protocols are enabled
Microsoft accounts aren’t blocked
EventSentry already includes a number of features that help detect security violations, rogue network devices, unauthorized software, suspicious network activity and more. But by utilizing the new validation scripts, you can fix many problems at the source – before they show symptoms.
The scripts are managed by NETIKUS.NET, updated regularly, and can be downloaded through the management console with a single click. Validation scripts are also tagged with keywords such as #server #compliance #stig-high-server to make sure that only relevant checks are assigned.
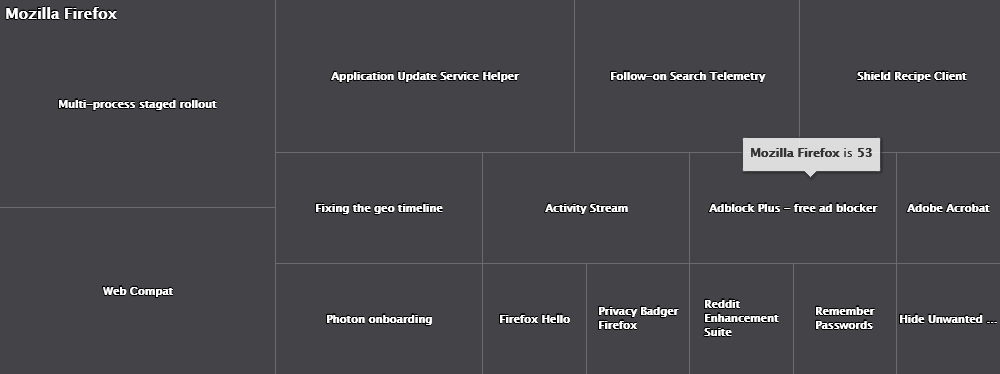
Which Browser Extensions are lurking in your network?
While web browser extensions can boost productivity and excite your end users, they also have inherent privacy and security risks. All major web browsers let users install as many extensions as they wish by default – without restrictions!
But do you actually know how many Firefox, Chrome or Edge extensions are installed on browsers across your IT infrastructure?
As an “extension” (no pun intended) of EventSentry’s software monitoring component, all browser extensions of Mozilla Firefox, Google Chrome and Microsoft Edge (Chromium-based) are inventoried with support for:
Alerts (extensions are installed/updated/uninstalled)
Searchable inventory
With this information at the fingertips, an initial discovery can be performed, a baseline set and reports or alerts can be received on a regular basis showing new extensions being installed.
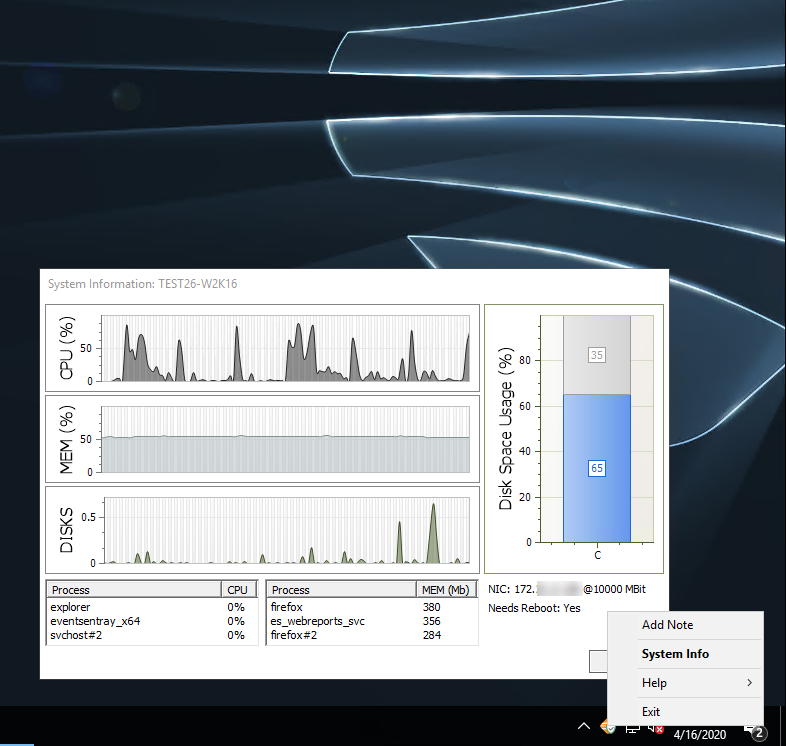
Troubleshoot, Document & Support End Users with “EventSentray”
Supporting your end users has probably never been more challenging, considering they’re distributed all across the place and not conveniently squeezed into an office building anymore.
With the tray app “EventSentray”, your end users can submit support tickets to many common ticketing systems via email or HTTP requests right from the tray with a customizable link. And the best part? Support tickets created by the app not only include pertinent system information (current CPU %, host name, uptime, …) but can also include a current screenshot.
But we didn’t just design the tray app to give end users a way to submit support tickets right from their desktop, but also to help sysadmins.
Let’s be honest, when we log on to a server then it’s often because something isn’t working the way it should. Wouldn’t it be nice if one had easy access to information like:
CPU, Memory, Disk Usage & Utilization
Top 3 apps consuming CPU and memory
IP address, host name and connection speed
Whether the host needs a reboot
Simply double-clicking the EventSentry icon and the System Information dialog will show all of the above information – and more. Hovering over the charts will reveal additional hardware information as well.
And for those working in teams with shared responsibilities, right-clicking the tray app also lets you add notes (including a screenshot) for the monitored host. Those notes are then visible in the web reports and ensure that everyone on your team is on the same page when you make significant changes to a server or workstation. Documentation is key!
Tracking Administrator Activity
Many compliance frameworks require that you track activity by Administrators (e.g. Domain Admins) on your network. ADMonitor users now have the ability to filter all compliance reports (e.g. Logon Activity, Process Activity) to only show activity from users with domain admin privileges.
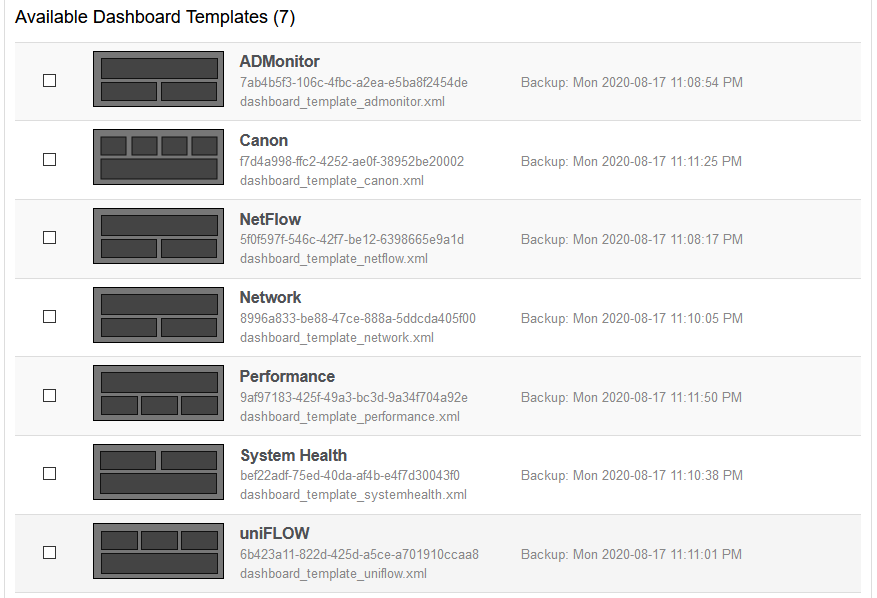
Dashboard Import / Export
To make setting up dashboards easier and faster, EventSentry now ships with a number of dashboard templates that you can import. You can also export your own dashboards and import them on another EventSentry installation.
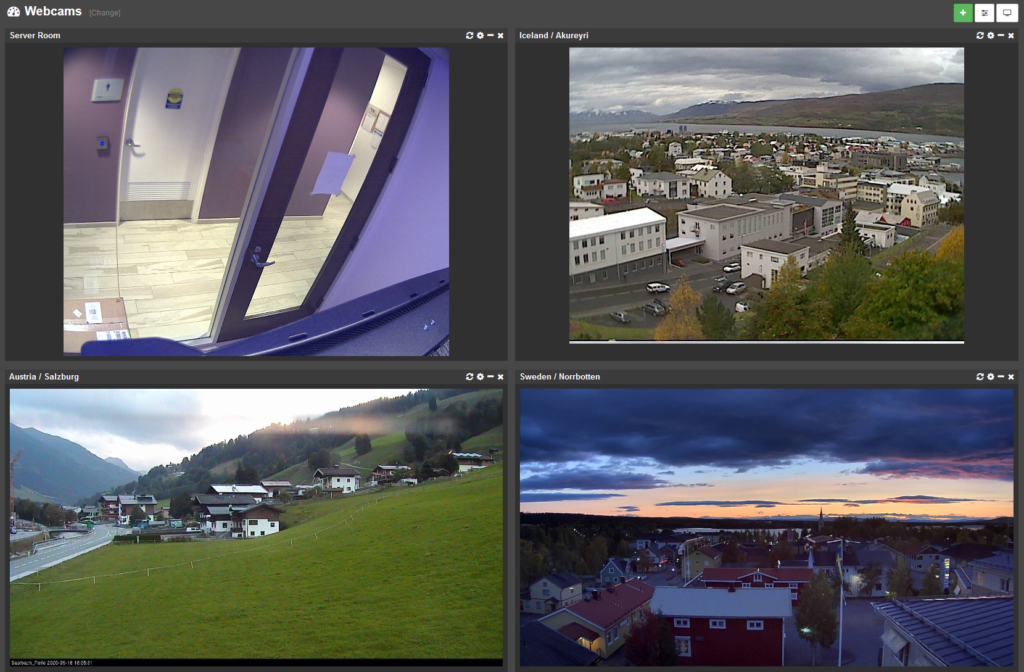
Webcam & Image Dashboard Tiles
The latest edition of the web reports includes a number of dashboard improvements, but the new image / webcam tile type definitely sticks out.
With the new “Image” tile you can point the web reports to a static image or stream to be displayed on any dashboard!
When China built an entire emergency
hospital in a matter of days in Wuhan – a city about the size of NYC that most
of us had never heard of – the world was watching with concern, but somehow
still expected and hoped that the crisis would somehow remain contained to
China, or at least Asia. People in Europe and the U.S. continued to go on about
their busy lives, occasionally glancing at the headlines coming from China,
where the government was taking drastic measures to curtail the spread.
It now seems beyond naive, even
childish, to have thought that the virus wouldn’t spread to other parts of the
planet. The world we live in today, where between 8,000 and 20,000
planes fly across the sky every single day, is the perfect conductor for a
virus with an incubation period as high as two weeks. This gave the virus, which
had already started making its way through Wuhan and China back in December,
more than enough time to slowly travel to other countries on planes and ships.
Flights coming to and from Europe back in 2010
Fast forward two months, and what is
currently taking place in many parts of the world is something we would have
only expected from a fatalistic science fiction novel or cheesy Hollywood
movie: a stock market crash on par with that of October 1929,
a large percentage of planes grounded either due to government mandates or lack
of business, borders shut, and almost 200 million people – from democratic countries
nonetheless – under a curfew that will likely last weeks. Empty shelves in
grocery stores, abandoned playgrounds and formerly busy streets are now empty
resulting in thousands of closed restaurants and stores, some of them possibly
forever.
The picturesque town of Heiligenblut in Austria, currently under quarantine in March 2020
The current global crisis feels like
a medley of 9/11, the 2008 recession and then some. Yet it’s not due to a war
or natural disaster but because of the respiratory disease that goes by the
catchy name of “Covid19.” This disease is caused by the SARS-CoV-2
virus that was at some point transmitted to humans from animals, as far as we
know from either bats, pangolins or a combination of the two (whatever happened
to eating tofu?).
What does all this have to do with
monitoring and network security?
But one country in Asia, located much closer to China than Italy and with a similar population density, has managed to avoid the disaster that is currently ravaging through Europe. That country is South Korea, where the number of new cases has slowed significantly since its peak at the end of February, without imposing curfews. South Korea has accomplished this with rigorous testing and isolation, including tracing contacts of infected people and quarantining them. Singapore, Taiwan and Hong Kong were similarly successful.
How did they do this? Data.
Since a large percentage of infected people show little to no symptoms –
particularly difficult to distinguish during flu season – the only way
to suppress the spread of the virus is to know who has the virus in the
first place. And then, once identified, immediately isolate the affected individuals
and people who had contact with them. If you wait until sick people show
up at the hospital, then you are already way behind the curve. For every person
that shows up at the hospital, you likely have twenty more walking around
infecting others.
Here at EventSentry we’re neither virologist nor pandemic experts. But
there are noticeable similarities between this outbreak and a
computer virus/malware infection. The purpose of monitoring after all is to be
aware of what is happening on the network so that organizations can take action
to stem the infection. You can only fight what you can see and measure.
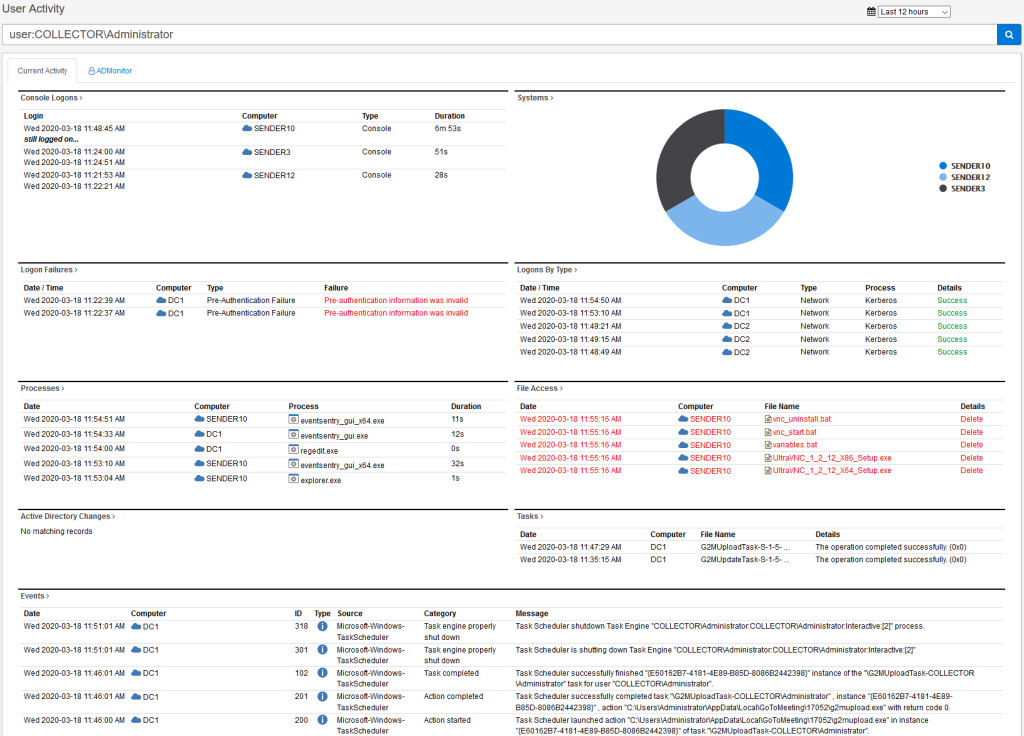
Activity of a single user at a glance
The equivalent of Covid19 testing in
IT is monitoring. Monitoring only part of your infrastructure isn’t enough –
just like testing only 1% of the population isn’t sufficient. Yes, the infected
hosts will eventually reach the monitored ones, but at that point the majority
of your infrastructure may already have been compromised.
Many computer viruses, when
infecting a computer (host), first attempt to silently infect other hosts
before they do damage in one way or another. SARS-CoV-2 has similar
properties with an usually long incubation period. During that time, the host
is unaware that he or she is carrying the virus, potentially infecting others
through direct or indirect (e.g. surfaces like door knobs) transmission.
The SARS-CoV-2 virus is quite sneaky
and would likely do well in the popular “Plague” game, where the
player creates a virus with the goal of infecting and ultimately killing the
entire world population. One of the most important properties of a virus in the
game is that it’s highly contagious but not too deadly – otherwise it would kill
all of its hosts before it can spread.
Thankfully, SARS-CoV-2 is neither as deadly nor contagious enough to accomplish this, yet it’s second only to the Spanish Flu that killed between 20-40 million people almost 100 years ago. See this article for more information on how Covid19 compares to past outbreaks.
Victims of the Spanish Flu in Kansas, 1918
Finding patient zero – the first person to have contracted a virus, is similar to finding the source of a malware outbreak. In medicine it may provide important clues on how to come up with a cure, whereas in IT security it can provide important information on how an attacker penetrated a network. Monitoring software like EventSentry doesn’t just detect problems in real time, it also collects troves of important logs and other system data that can be of incredible value after a network has been compromised. China is still desperately trying to find and confirm patient zero, who may have been infected as early as October 2019.
On our never-ending quest to slash cost in order to maximize profits, manufacturing of both medicine and medical supplies has been outsourced to China, India and other countries. While there is nothing wrong with saving costs and manufacturing items where it costs less, it’s clear that there is a benefit of manufacturing certain products in the country where they are being used.
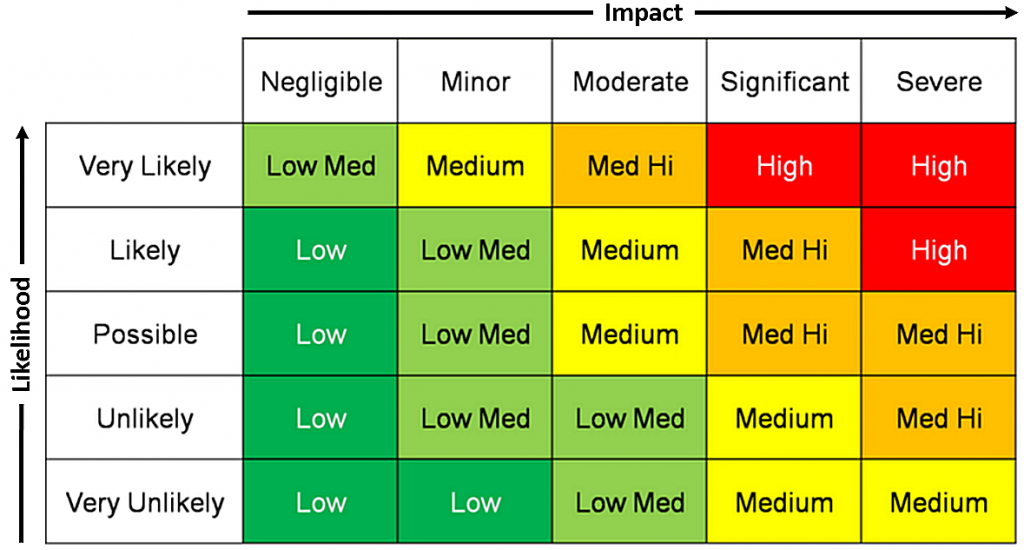
Similarly, cost savings in IT budgets that compromise the overall security of the IT infrastructure and with it the company itself, rarely pay off in the long turn. As you can see from the matrix below, even a very unlikely circumstance that will have a significant impact on a business has a medium risk and should be addressed.
Risk Matrix
But in the midst of the all the
chaos and uncertainty, there also upsides. The severe reduction of air traffic
and travel give our planet a long overdue breather, as satellite images in Italy have shown. It’s also noteworthy that air pollution (and smoking) make
the lungs much more susceptible to respiratory diseases like Covid-19.
We need to remind ourselves that we’re not robots and machines but mammals that live on a planet shared with nature – animals – their viruses included. As we humans continue to encroach on their habitats and land, the risk of another deadly virus spreading doesn’t go away. Watch this short 5-year old video about bats and the viruses they carry.
For me it’s still difficult to comprehend that the current pandemic is connected to consuming bats, pangolins (most of which are endangered) and other wildlife. Some risks are just not worth taking, and it would be prudent of the Chinese government to permanently ban this obviously dangerous practice.
In the meantime people will need to continue to isolate, self-quarantine or shelter in place until the number of new cases continues to decline and toilet paper is available again.
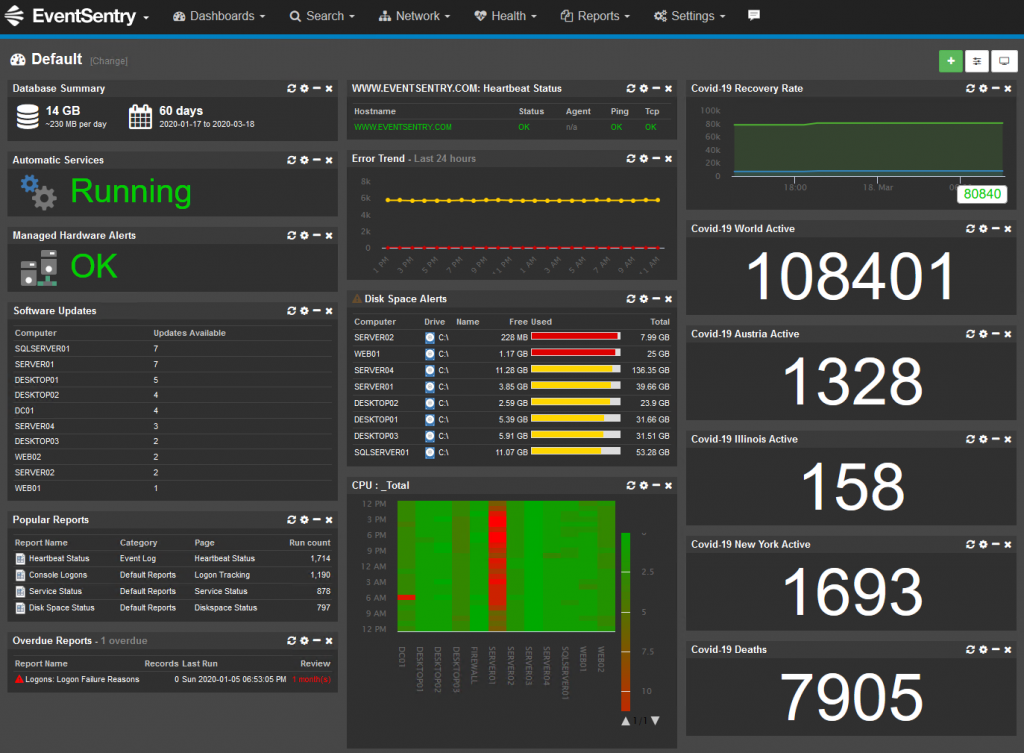
To keep an eye on Covid-19 cases in your country and/or state with EventSentry (v4.1), you can follow the instructions in this HowTo and view Covid-19 stats in any dashboard or performance chart.
As an IT professional I encourage you to stay alert, as many bad actors are exploiting the current chaos with phishing campaigns for a variety of nefarious reasons. We highly encourage you to consider monitoring workstations and laptops with EventSentry to ensure you have complete visibility and prevent a bad situation from becoming worse, we are offering discounts on a case-by case basis. In addition to monitoring all the things you’re familiar with from your servers, EventSentry monitors laptop batteries, Bitlocker status, outdated software and more.
Thank you for being an EventSentry customer, stay safe and positive during this difficult time.