We’re again excited to announce the availability of EventSentry v3.4, the latest release of our hybrid SIEM monitoring suite.
EventSentry v3.4 delivers a number of new features to
- Protect yourself against ransomware attacks
- Detect lateral movement on a network with collector thresholds
- Identify outdated software on your network
- View detailed bandwidth utilization (requires NetFlow)
- Monitor attached UPS devices
- Integrate with open source solutions (Graylog, ELK, Nagios Log Server & others)
and more. We’ve also been focusing on making the data EventSentry collects more actionable and subsequently more helpful, and as result you will see additional contextual data provided with some alerts & reports, and one new search page in EventSentry.
All in all, this upcoming release has a lot of improvements in store to help you do your job better by ensuring that your network is as reliable, secure and fast as possible.
Ransomware
While high-profile Ransomware attacks have slowed down somewhat in recent weeks, businesses – especially small businesses – are still hit with Ransomware infections every day. Even though EventSentry is not positioned as a AV or a AntiMalware software, it does include a variety of functionality which can detect Ransomware outbreaks.
What sets EventSentry apart from AV and most AntiMalware solutions is that it looks for pattern exhibited by the Ransomware – regardless of the variant. What’s new in version v3.4 is the ability to detect changes to the MBR and bootsector as well as the ability to calculate the entropy of (changed) files.
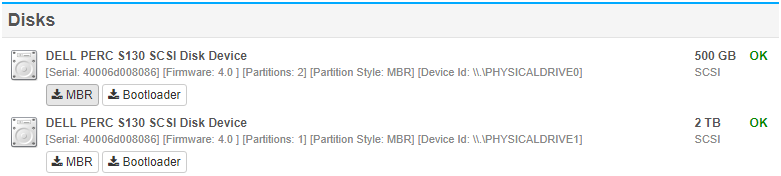
MBR/BootSector Monitoring & Backup
Some more recent Ransomware variants modify the MBR and/or boot sector and trigger a reboot to initiate an offline encryption process. EventSentry v3.4 can now monitor the MBR and detect changes in near real-time to alert the admin when suspicious activity is occurring.
By utilizing EventSentry’s advanced filtering engine it is also possible to potentially stop the encryption process, e.g. by hibernating the infected host. EventSentry even backs up the MBR and boot sector, making it possible to repair an infected system (with a boot disk) without having to perform a full restore from backup.
File Entropy
Entropy describes the randomness of a file, essentially a metric that can help detect compressed and encrypted files.
Since most Ransomware encrypts large amounts of files, EventSentry can utilize the entropy of a file, combined with event log thresholds, to make a determination that a Ransomware infection is in progress and take corrective measures.
Lateral Movement Detection with Thresholds
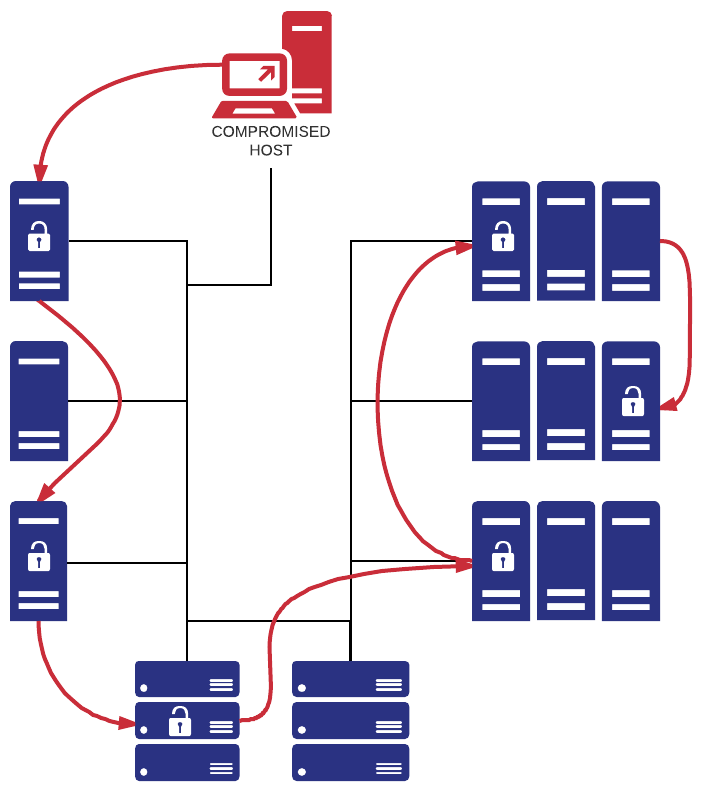
EventSentry has always included agent-side thresholds in order to throttle the alert volume or detect repeated events. Because these thresholds were executed on the agents, event patterns which involved more than one host could not be detected that way.
By adding a threshold component to collector – which analyzes and processes all events in real time – we can leverage this feature to new heights and detect network-wide event-based patterns – in real time!
Collector-side thresholds are configured exactly like agent-side thresholds with one the key difference – the threshold limit applies to all aggregated events sent to the collector. Collector-side thresholds also introduce the “Group By” setting that makes the lateral movement detection possible – the ability to count unique instances of an event property, and not just the total number of events.
Some of the event-based threat patterns you can detect:
- The same user logging on to multiple hosts within a specific time frame
- A process spreading (trickling) across multiple hosts within a specific time frame
- A user running too many processes – either on a single or multiple hosts
- Authentication failures of a user on too many hosts
- Too many unique logon types used by a user account
Any event property and insertion string can be used to craft thresholds – the sky is the limit.
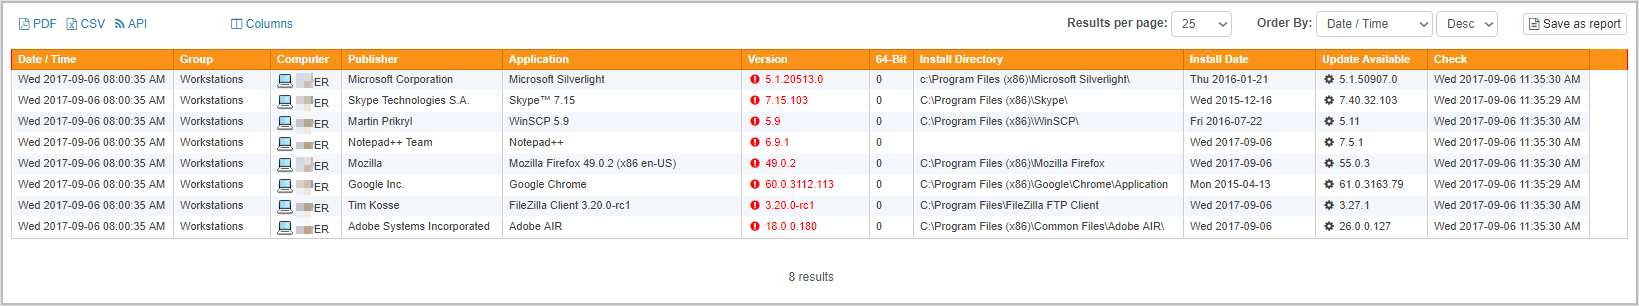
Software Version Checker
Earlier versions of EventSentry include a substantial hardware, software and patch inventory, making it extremely easy to find out which software packages are installed on your network, but also get alerted when software is installed or removed from a server/workstation.
In v3.4 we are taking this to the next level by providing the latest version available from the publisher for a growing list of 100+ software packages so that you can effortlessly identify outdated software on your network. You can now create reports listing any software on your network which is outdated, a dashboard tile is also available. The Web Reports refresh the version info list every 2 hours to ensure all reports are accurate.
If an application you are using on your network is not currently included then simply email us the name of the software as it is detected by EventSentry (and ideally the URL where we can obtain the current version) and we will add it to our list.
64-bit Web Reports for Windows
The EventSentry web reports are now available as a 64-bit application, and upgrading to v3.4 will automatically upgrade the existing v3.x 32-bit web reports to 64-bit on 64-bit when installed/upgraded on a 64-bit version of Windows. The new 64-bit web reports will allow you to run larger reports that would not run due to limits with the address space associated with 32-bit applications.
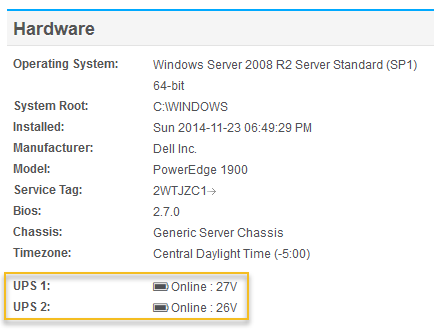
UPS & Battery Monitoring
Any UPS directly attached to a server/workstations that is detected by Windows can now be monitored by EventSentry. The status of the UPS will show up on the host inventory page, and alerts will be generated when a host is on battery power and back on AC power. EventSentry can also initiate a shutdown when the remaining run-time or charge level falls below a certain limit.
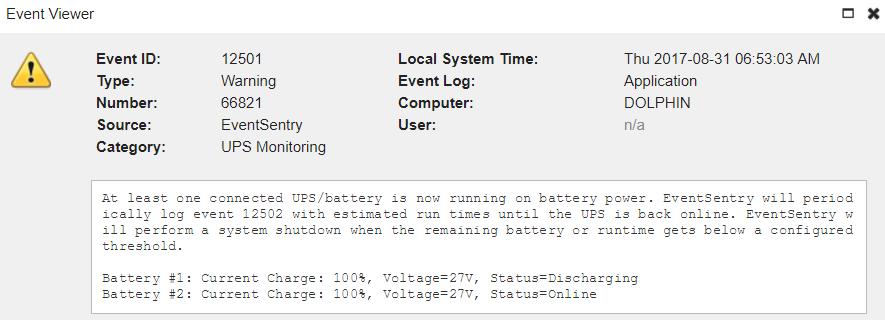
Batteries in laptops are also detected and listed on the host inventory page (battery capacity and current charge level), but generated alerts are informational only.
User Activity Tracking
While EventSentry provides its users with a wealth of information from multiple angles, it can be tedious to piece together data from multiple reports that is associated with a specific user. Data which can be linked to a user is scattered among process tracking, file access tracking, compliance logons and other pages.
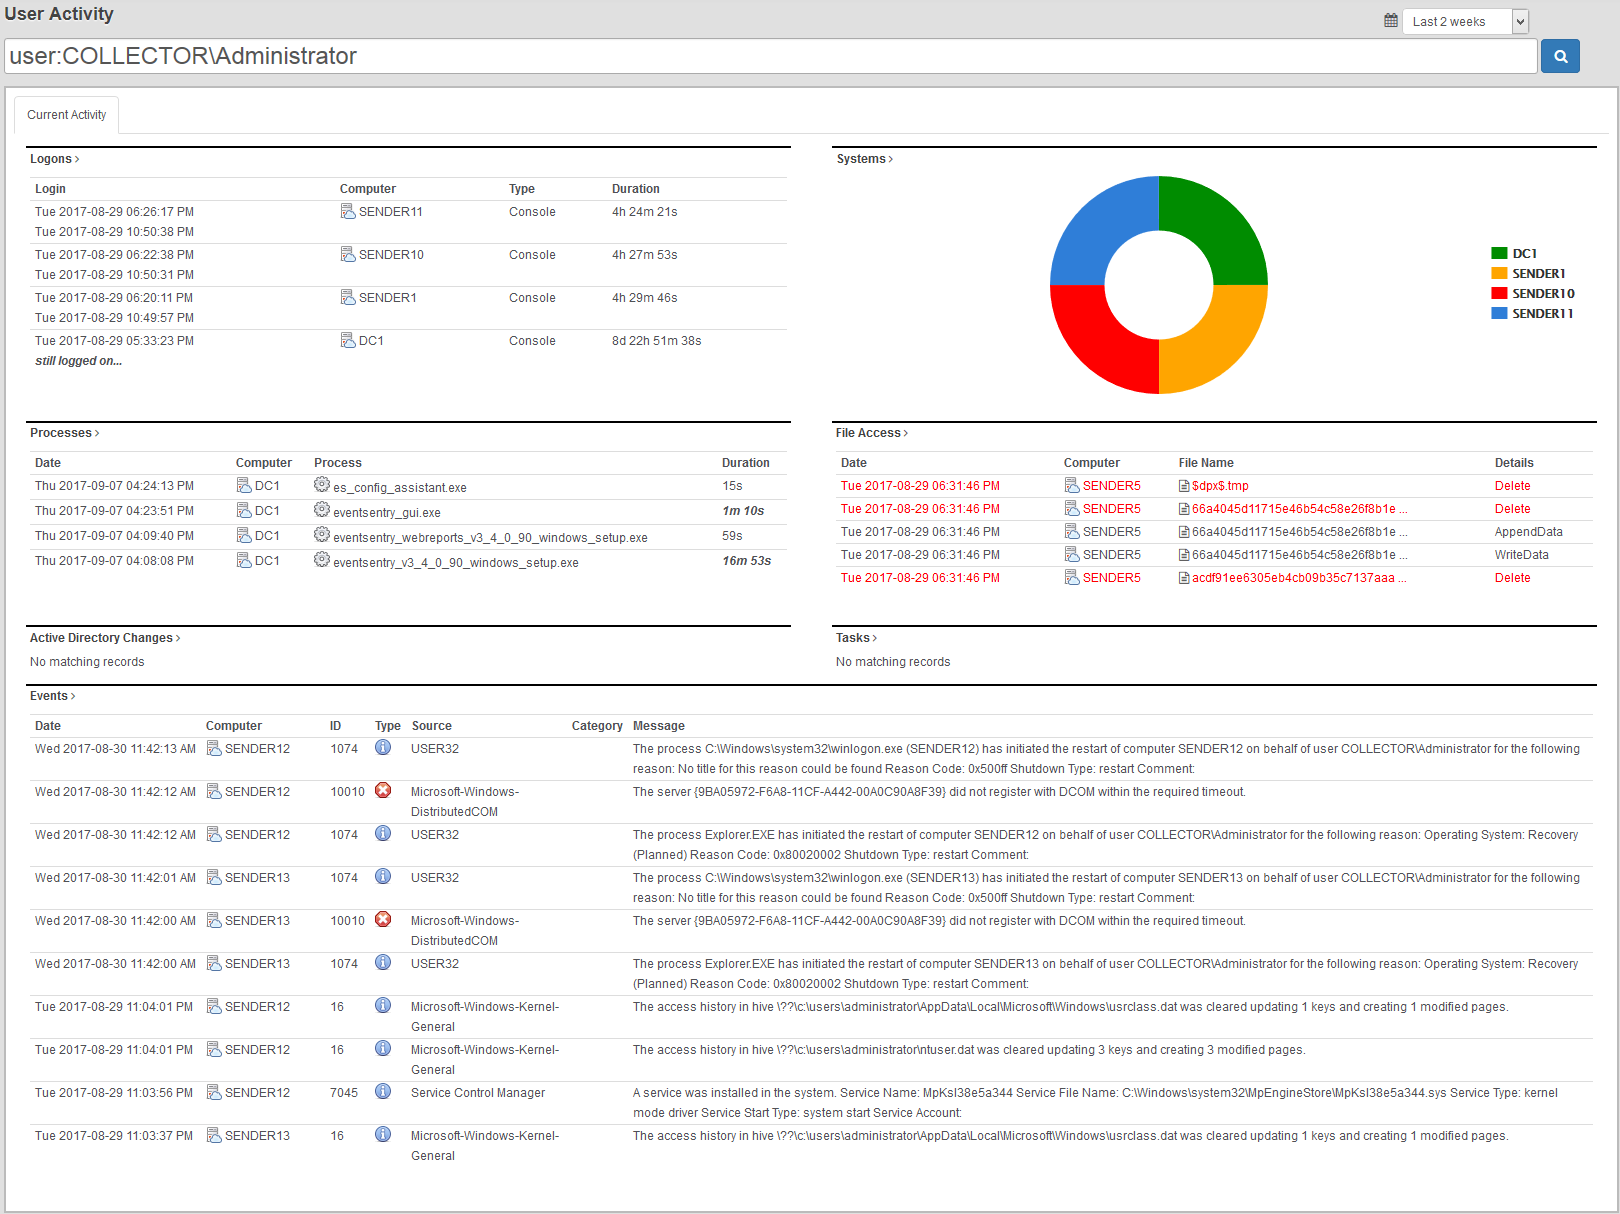
The new “User Activity” page, which is located in the “Dashboard” menu, solves this problem by displaying data from the following pages on a single page:
- Logons
- Processes
- File Access
- Active Directory Changes
- Tasks
- Events
The user activity page makes seeing all activity by a user as easy as never before!
Integration with third-party log management solutions
A few months ago, one of our users approached with the need to integrate EventSentry into an existing log management system which was already in place at the location where EventSentry was to be deployed. While reviewing the request we recognized that even though we position EventSentry as a one-stop log management solution with a compelling and robust web-based reporting component, an integration with other products can be helpful in some cases.
- Supplement EventSentry’s built-in reporting with additional reporting
- Integrate EventSentry with an existing log management solution located in a different business unit
- Integrate EventSentry’s sophisticated real-time agent and deployment infrastructure with a different log management back-end
In version 3.3 and earlier, EventSentry can be integrated with 3rd party products using the HTTP, process and Syslog action. The HTTP & process action are intended to be used with ticketing systems where only a low volume of alerts are submitted while the Syslog action obviously supports submitting a high volume of events. The Syslog format was however limited to the traditional RFC 3164 format, making an integration with other log management systems difficult.
Starting with version 3.4, EventSentry now supports the following formats in the Syslog action
- RFC 3164 (legacy)
- Snare
- RFC 5424
- GELF (Graylog)
- Nagios Log Server
- Common Event Format (CEF)
- JSON (customizable)
If a log management server you need to integrate with is not listed above but supports the JSON format, then you can craft your own JSON packet with the JSON format, also introduced in v3.4.
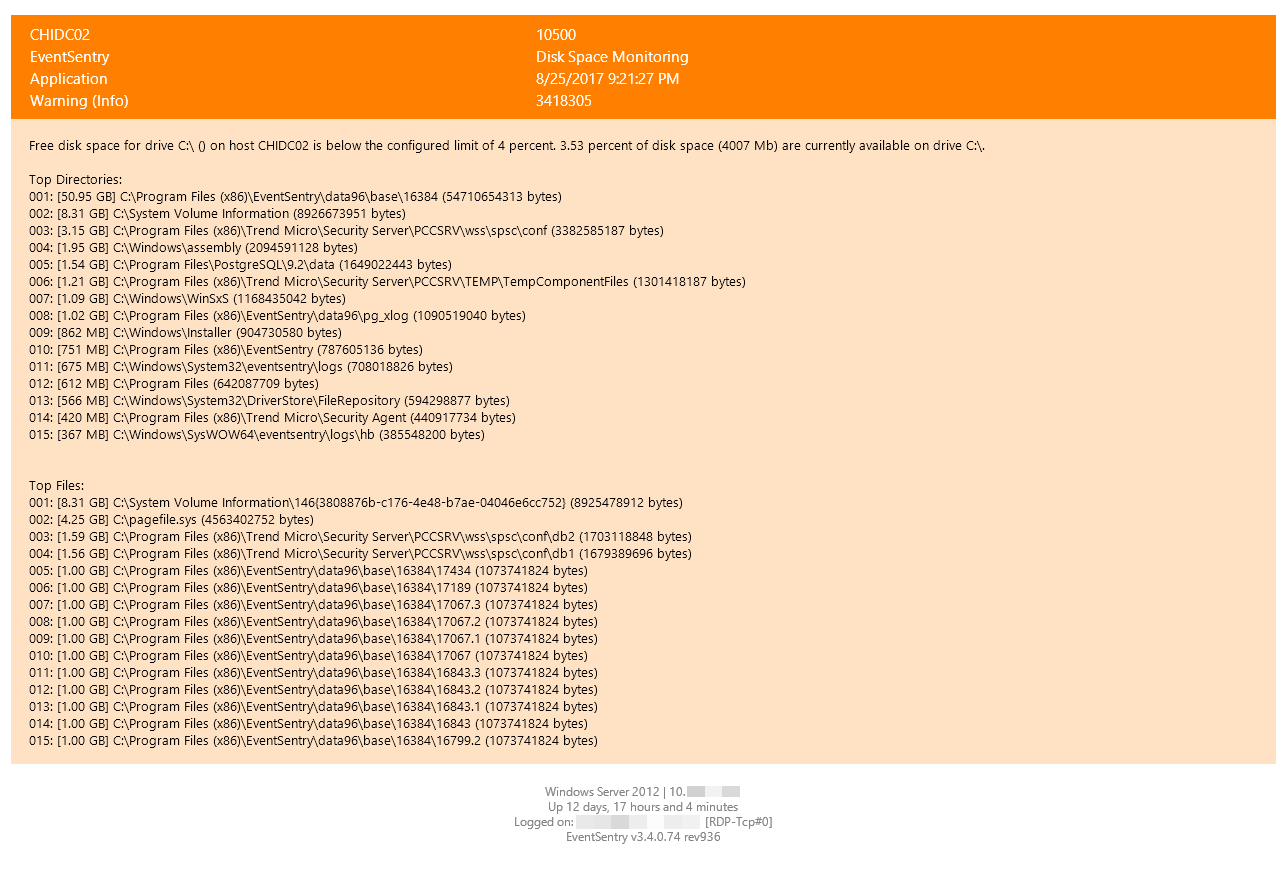
Disk Space Alerts
Part of the effort to make EventSentry’s alerts more actionable is reflected in our improved disk space alerts which now list the 15 largest files and folders of the volume where disk space is low. The supplemental data will in many cases be enough to immediately identify the culprit so that corrective action can be taken immediately, without the need to run disk space analyzers on the volume.
Audit Policy Status
Since the introduction of the compliance tracking components, EventSentry has been recording all audit (and many other!) changes performed in Windows as part of the “Policy Changes” feature. It wasn’t however possible to see the current status of all audit categories and subcategories at a glance. Reviewing the current audit status of all monitored hosts can be important however, if only to verify that group policies are configured correctly.
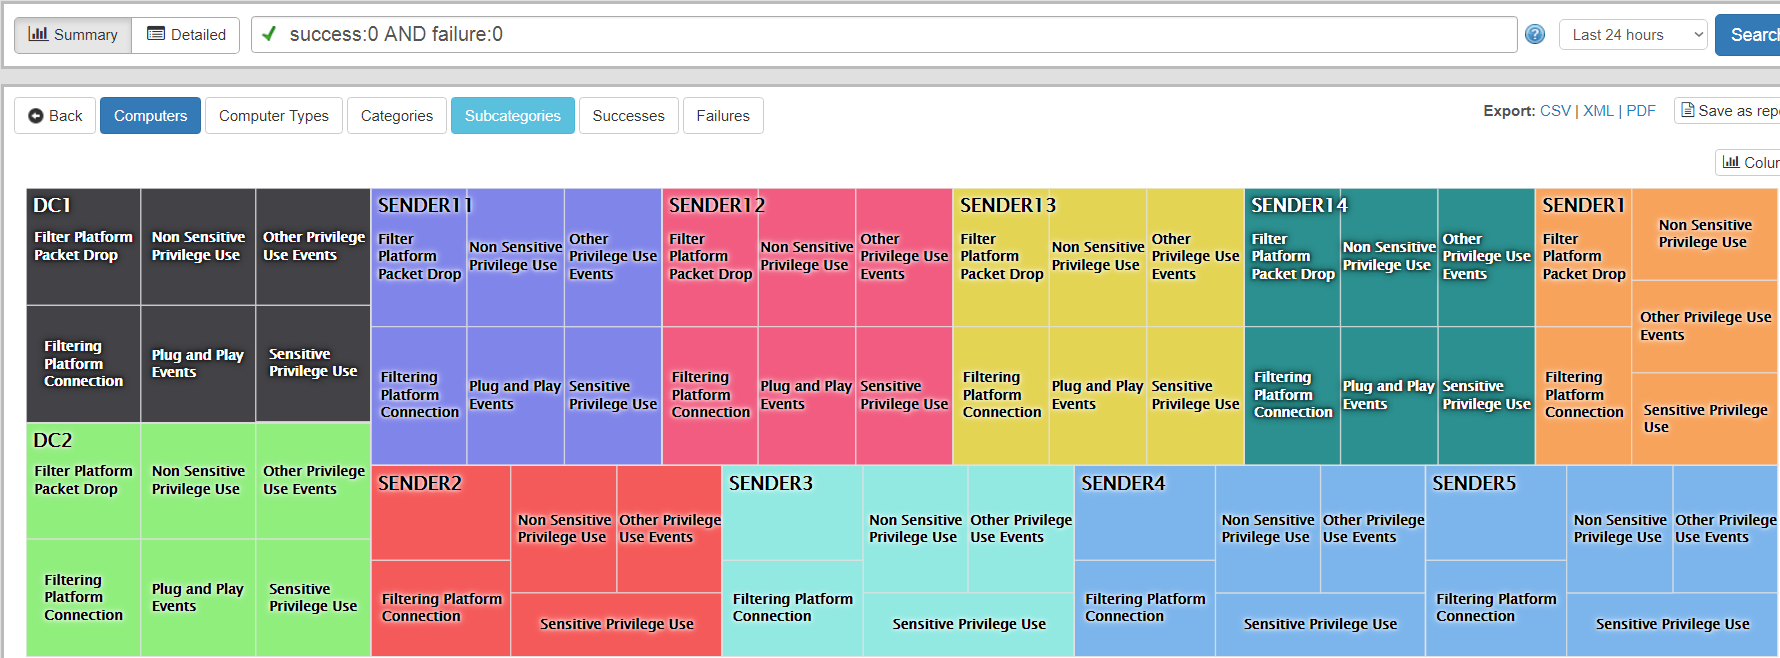
In v3.4 we now have the new “Status” page available under “Compliance -> Audit Policy” which delivers information such as:
- Compare/review audit settings of a particular sub category (e.g. “Registry”) among all monitored hosts
- View all disabled audit settings across all or select hosts
- (Re)view audit settings based on computer types (e.g. domain controllers, servers, workstations)
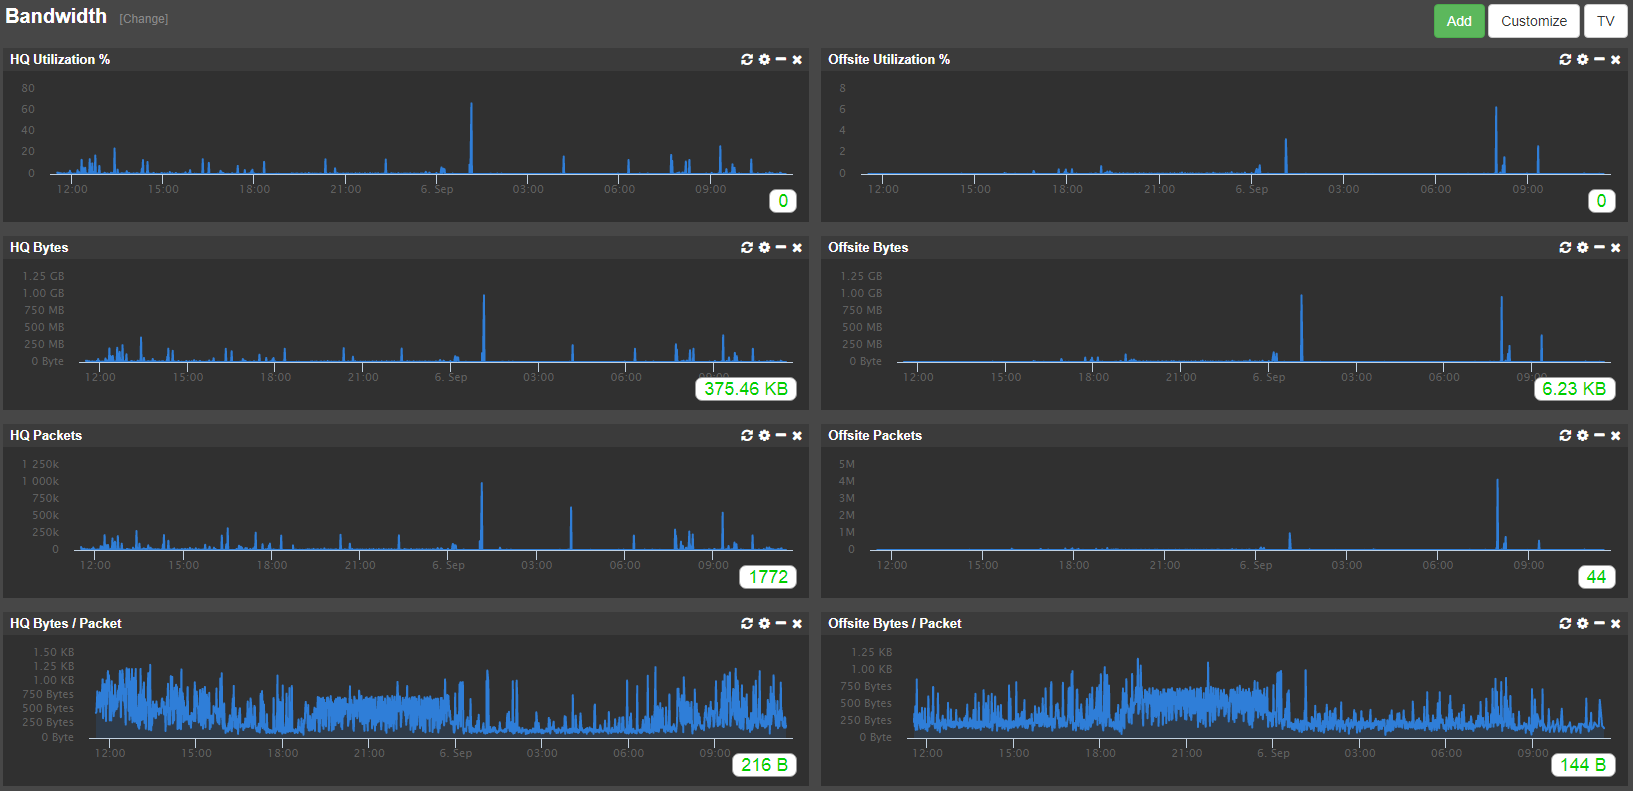
NetFlow Bandwidth
Our NetFlow component can now provide bandwidth visualization based on the collected NetFlow data. The information can either be accessed on the NetFlow page or as a dashboard tile. Even though bandwidth data can already be determined using SNMP, the data gathered by NetFlow should be preferred since it contains additional data not available via SNMP, such as:
- Packets sent/received
- Bytes sent/received
- Bytes per packet
- % Utilization
Bytes per packet as well as packets sent received can be used to detect anomalies, e.g. when a host sends a large amount of network packets, or network packets with large/small content.