Anybody who’s looked for answers on the Internet has likely stumbled across a “TOP X LISTS”: The “10 things famous people do every day”, “Top 10 stocks to buy”, the “20 books you have to read” are just some examples of the myriad of lists that are out there offering answers. You may have even stumbled upon a few “Top 10 (or 12) Events To Monitor” articles too.
Why We Love Top 10 Lists and 10 Reasons Why We Love Making Lists provide some insight as to why these types of articles keep popping up all over the place for just about any topic. And it makes sense when you think about it! You’re facing a new problem/challenge you presumably know little about, get a “Hey, just do these 10 things!” list back and: Done.
But while “Top 10” lists are surely useful for a variety of topics (“Top 10 Causes of House Fires“), they are less useful when it comes to identifying event IDs to monitor. Why? Because auditing 10, 20 or even 30 events is just not enough to detect suspicious activity or help with forensics. Just consider that Windows 2019 potentially logs over 400 different events to the event logs – almost 3 x as many as Windows Server 2003 did. Sure, in practice Windows 2019 likely only logs some of these 400 events, but even a minimalist would probably agree that monitoring fewer than 10% of all events is probably not going to give you a whole lot of visibility into your network.
But before we go any further, let’s distinguish between auditing and monitoring. Enabling auditing tells a system to constantly create a trail of activity that can later be analyzed – either manually or by software. Monitoring on the other hand means that you’re actually doing something with those events – whether that’s storing them in a different location, analyzing them or getting email alerts.
But enabling auditing (correctly) is always the first step that any subsequent process builds on. And, enabling auditing is not only free but generally doesn’t impact system performance either (the only exception are large event logs that can affect memory usage).
Yet the sad reality is that many organizations out there are still not properly auditing their Windows servers. A system that’s not auditing its activity gives you neither the ability to respond to important events, nor does it let anyone retrace the steps of attackers after an intrusion has occurred (forensics). So let’s repeat: Regardless of whether you have a monitoring solution in place or not, or are planning on getting one, auditing should always be on and needs to be the first thing you do.
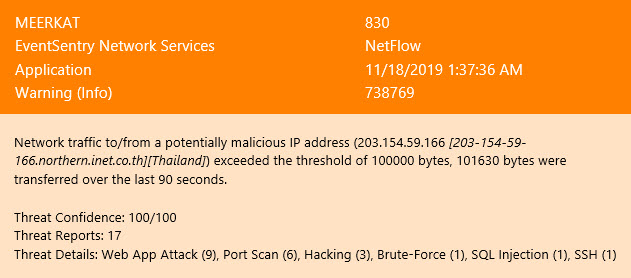
Auditing alone is, of course, no longer sufficient to maintain a secure network, and not only because clearing your event logs is one of the first thing intruders do after they attack. As the developers of EventSentry we’re obviously a little biased, but with proper event log monitoring in place, you can:
- Store events in a secure location, safe from tampering & deletion
- Correlate events across multiple hosts
- Receive real-time alerts for critical events
- Detect suspicious behavior
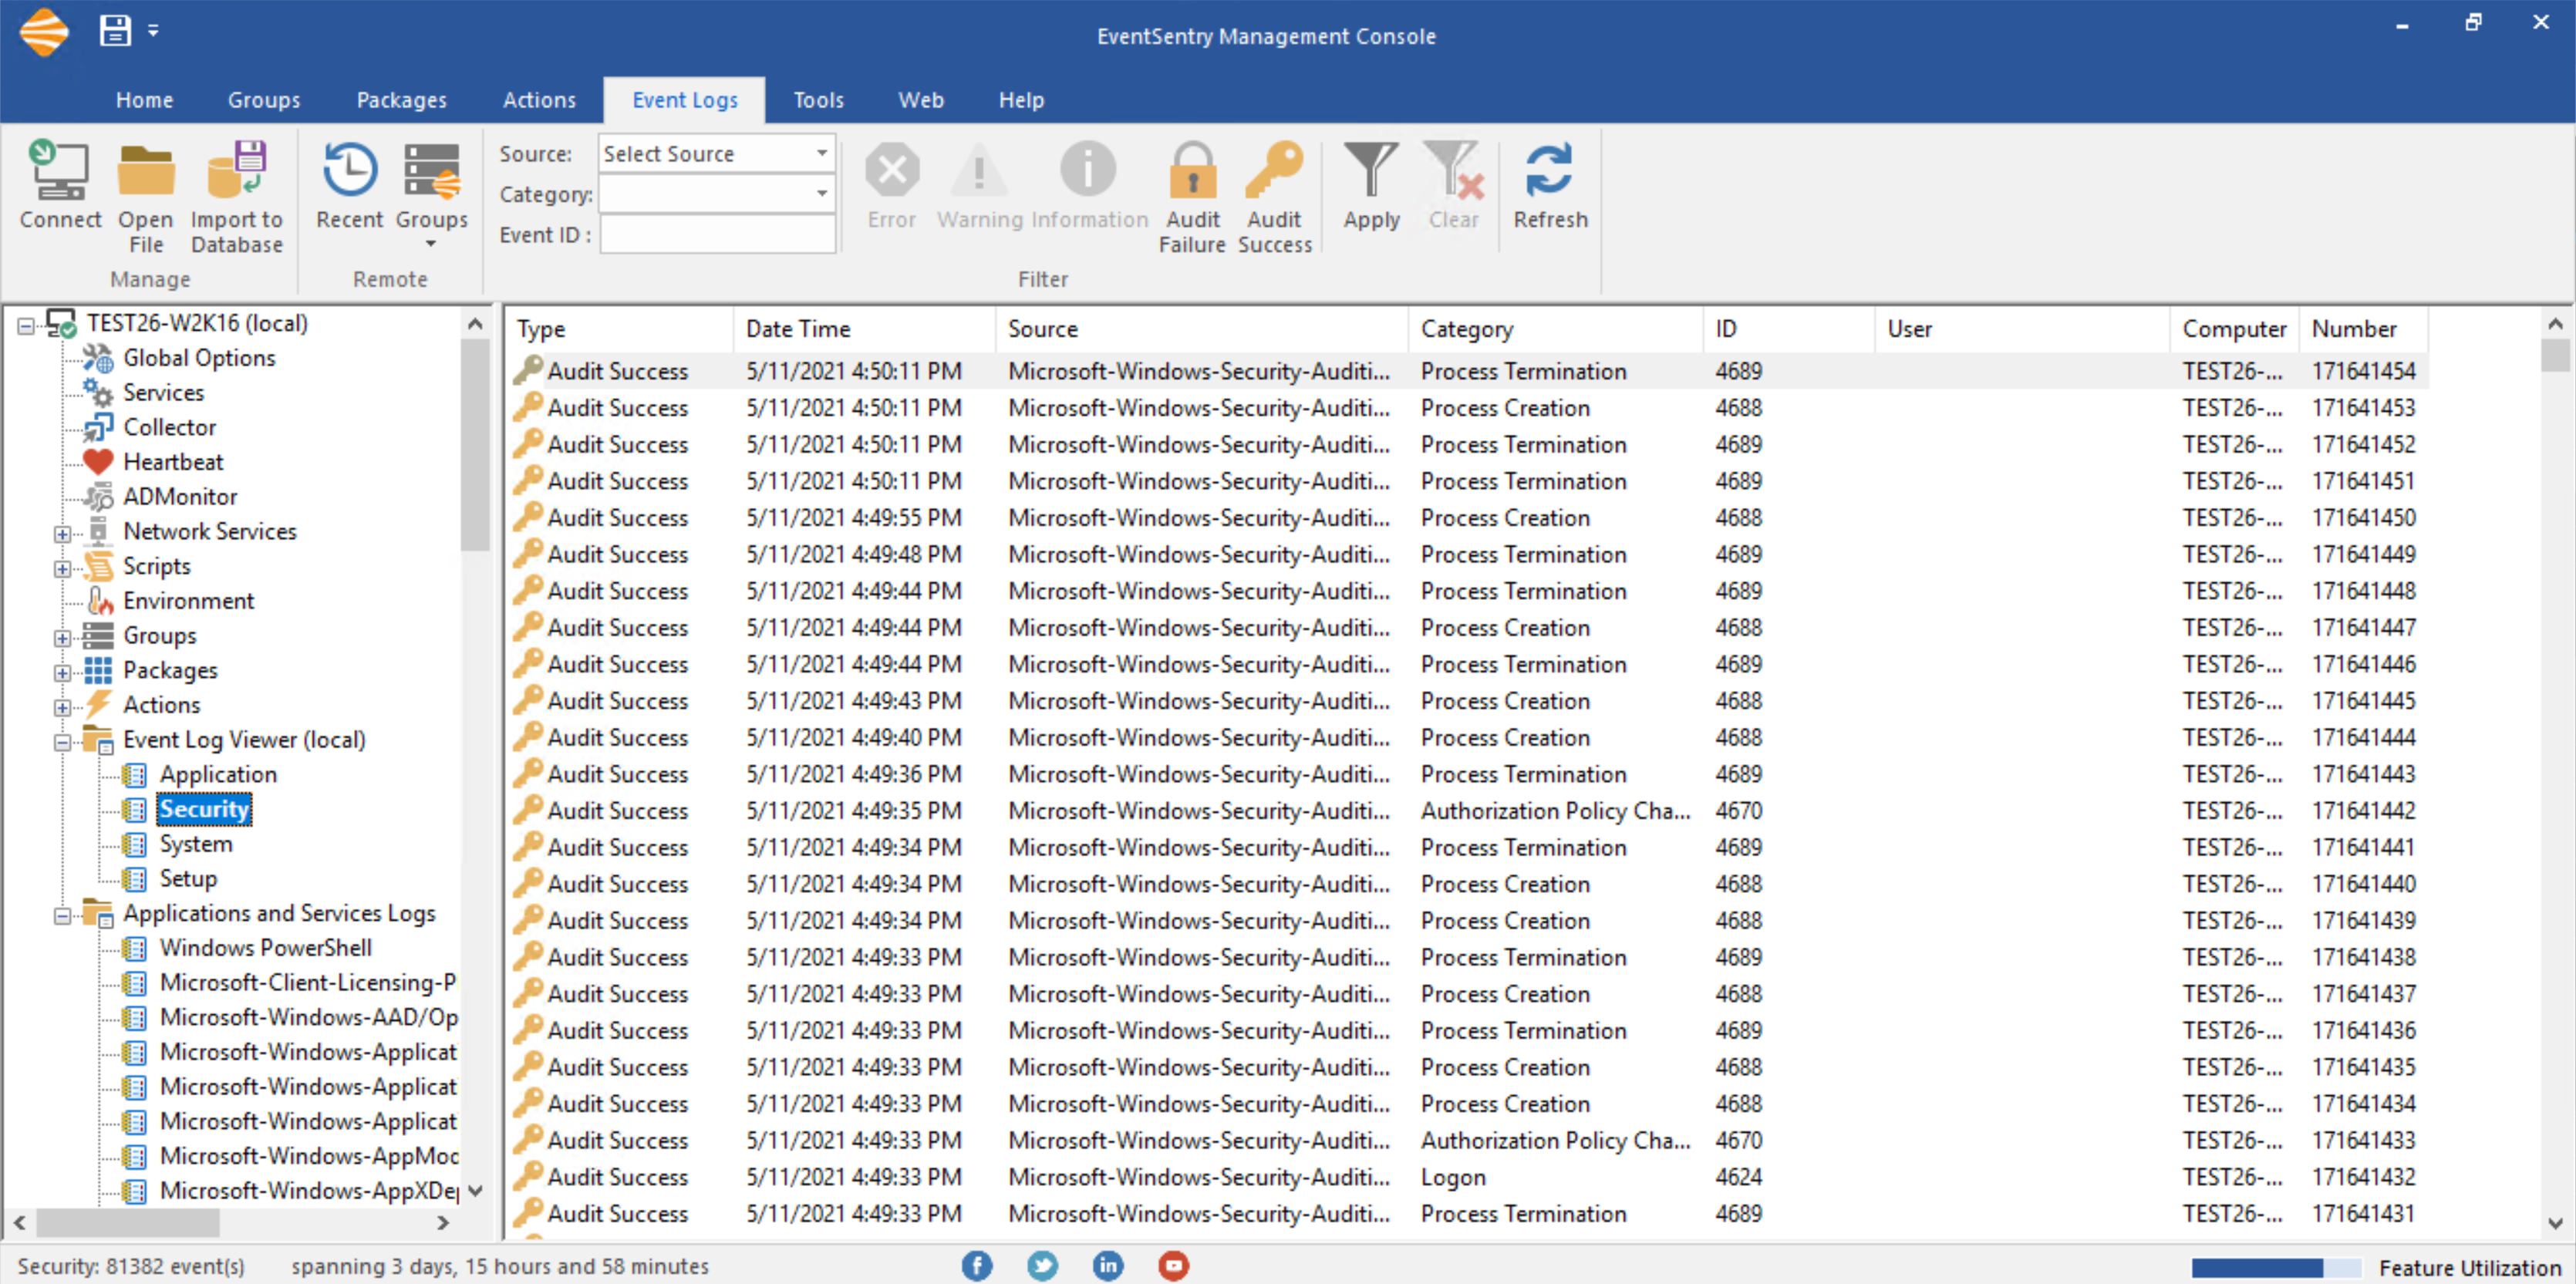
and more. So, whether you’re in charge of a grocery store in Idaho, a government contractor in Virginia or in charge of distributing oil for the Eastern U.S., the events below should always be monitored:
Now, going all out and monitoring 85 events as the baseline may seem crazy and overkill – after all you’ve never seen a “Eat these 85 foods to be healthy” list – but let’s remember the 4 reasons you should monitor these events:
- You can never retroactively enable auditing. More is better.
- Most of these 85 events log events infrequently.
- Attackers don’t want you to enable auditing.
- The Internet is crazy.
And just when you think you’re good, one needs to point out that even auditing these 85 events is not sufficient if you have to be compliant with regulations like CMMC, PCI and others (if you need to be compliant then I recommend our free validator here). And here are 3 great reasons those events are a good baseline:
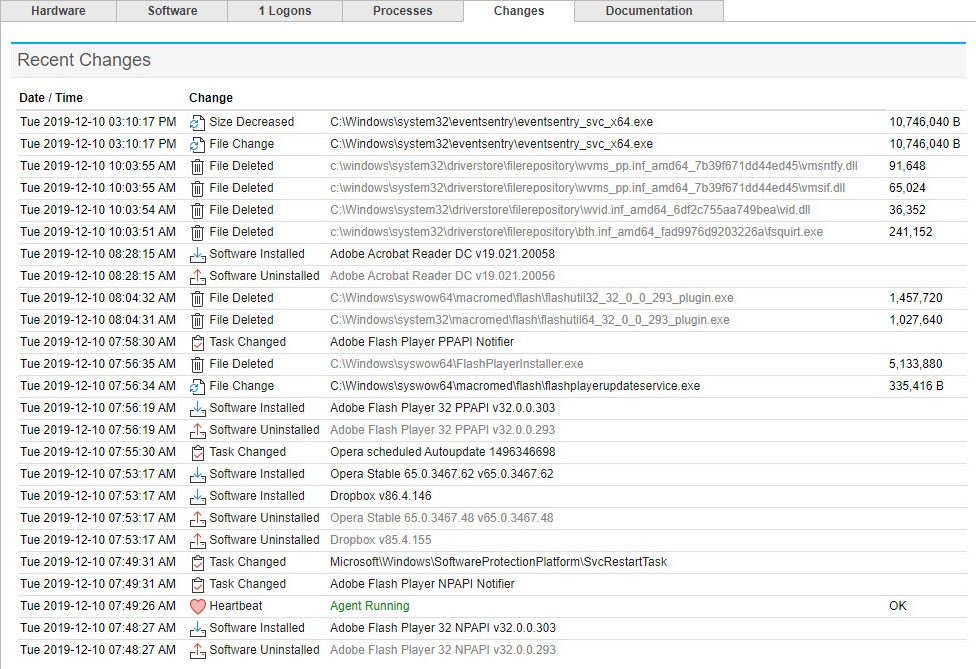
- They document changes made to the OS (e.g. scheduled task added)
- They report a security issue (e.g. group membership changed)
- They are logged infrequently and thus won’t spam your event log(s)
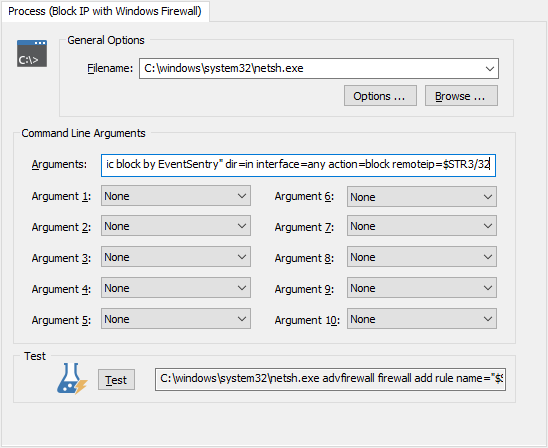
To activate these audit settings, either run the auditpol commands at the bottom of the list on all hosts or, a much better option, setup a group policy that will ensure these settings are always enforced across the entire domain/forest. The linked page includes instructions on how to import the necessary audit settings into a GPO, but here they are just in case:
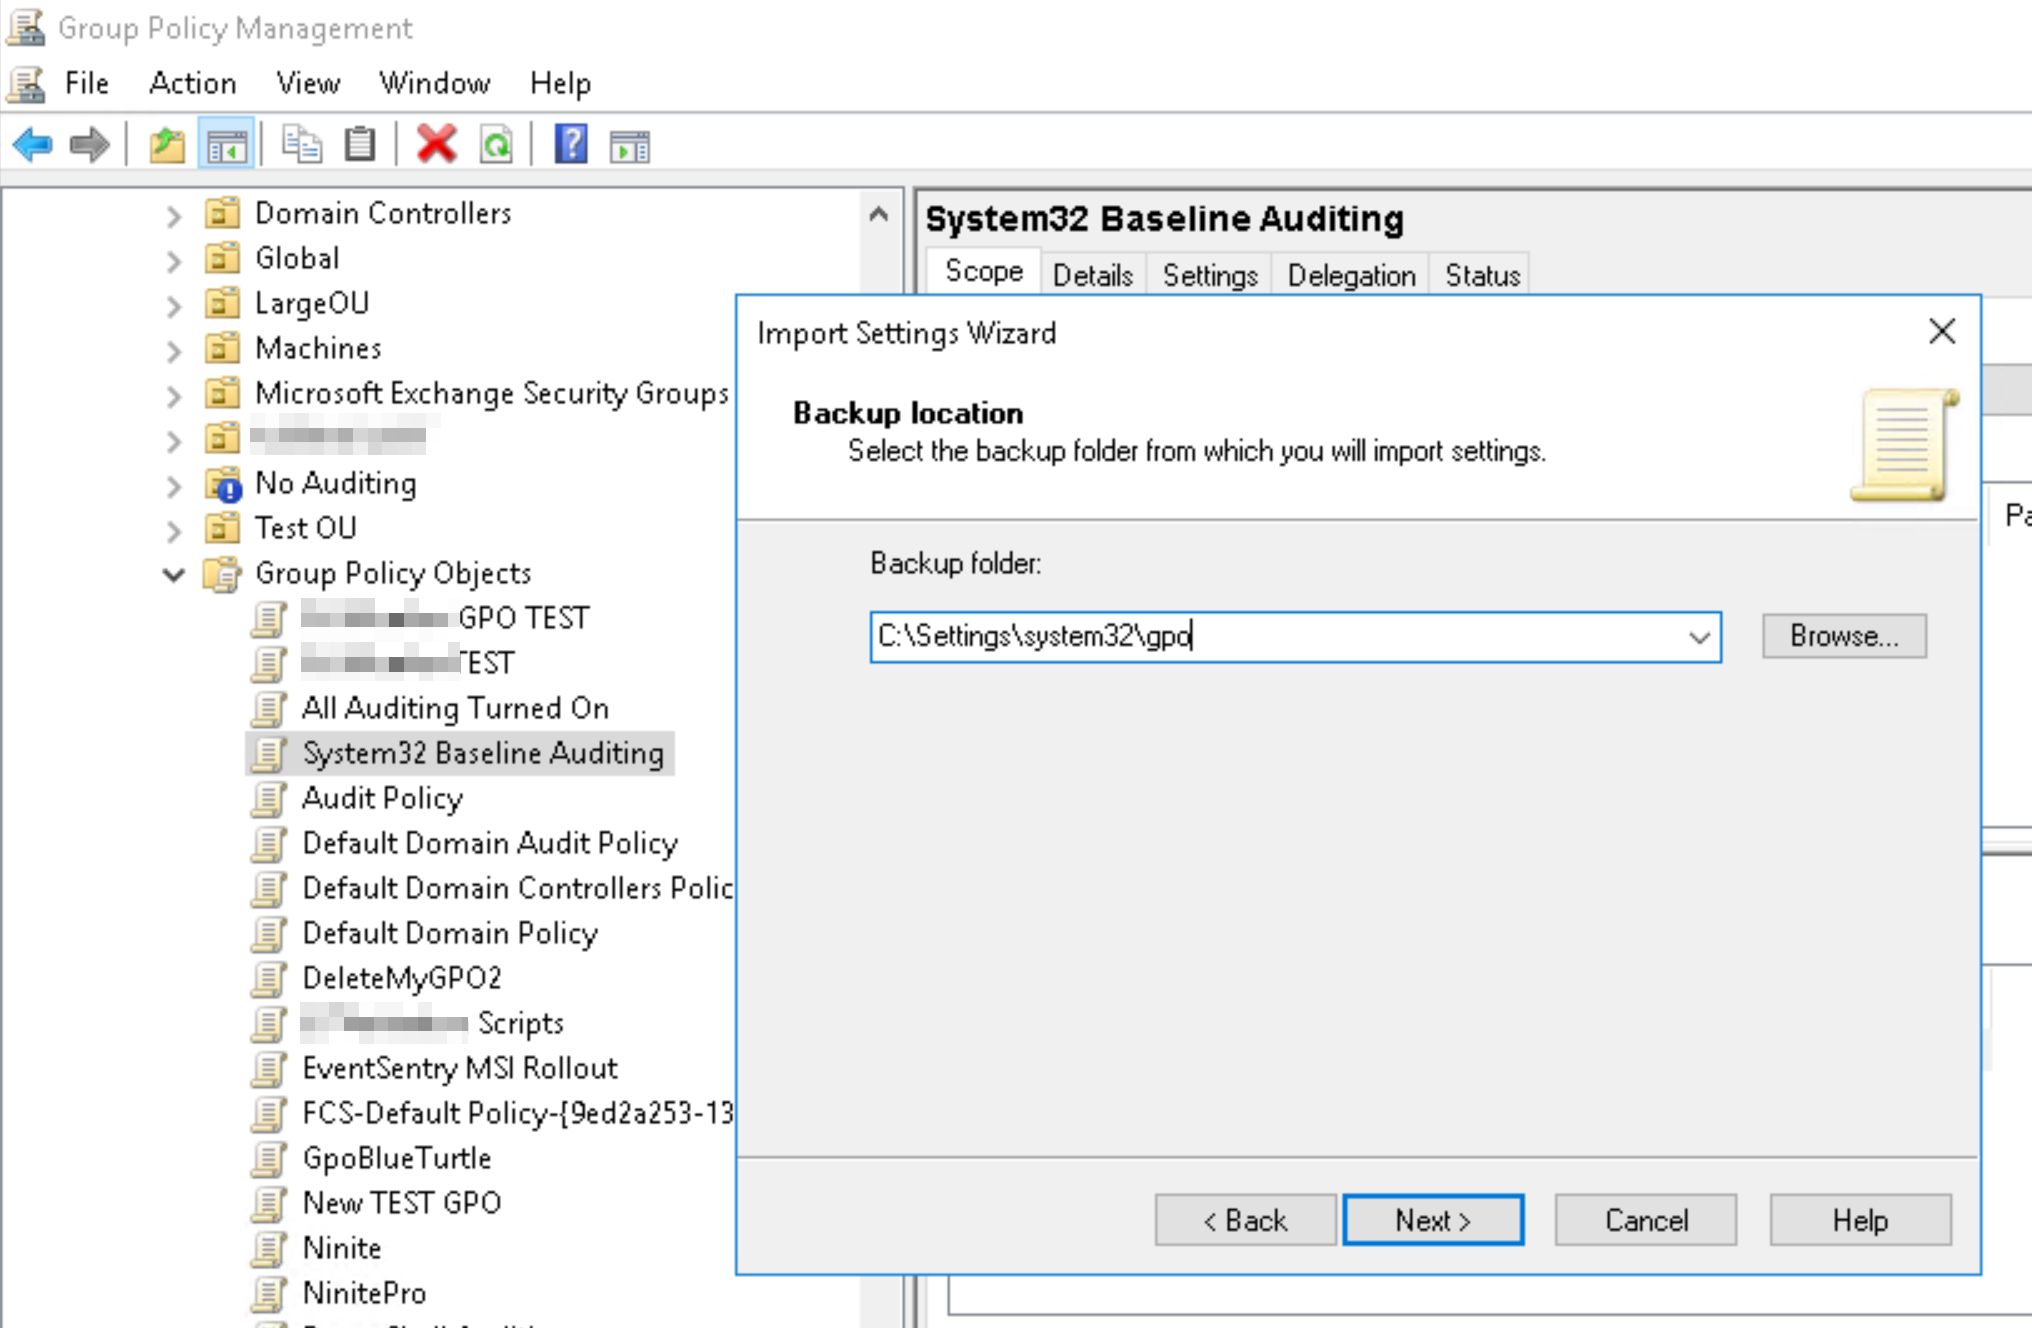
- Open the “Group Policy Management” application
- Navigate to the “Group Policy Objects” container of the applicable domain
- Right-click the container and add a new GPO object with a descriptive name (e.g. “Mandatory Auditing”)
- Right-click the newly created GPO object and select “Import Settings”
- Proceed with the wizard and point the “Backup Folder” path to the folder where the zip file was extracted to
- The GPO object will now contain all audit policies for all events listed above
- Link the GPO to the domain or select OUs
Larger networks may require different audit settings depending on server role, location and security level which may result in more complicated group policies. Remember that EventSentry can keep track of your audit policies to make sure your policies are accurate.
Happy Auditing!