Almost everyone in IT has heard of VNC – which actually stands for “Virtual Network Computing”. The RFB (Remote Framebuffer) protocol which VNC relies on, was developed around 1998 by Olivetti & Oracle Research Labs. Olivetti (unlike Oracle) isn’t much known outside of Italy/Europe, and the ORL was ultimately closed in 2002 after being acquired by AT&T. But enough of the history.
When the need arises to remotely log into a (Windows) host on the network, Microsoft’s Remote Desktop application (which utilizes Microsoft’s RDP protocol – not RFB) is usually the default choice. And why wouldn’t it be? It’s built into Windows, there is no additional cost, and it’s usually quite efficient (=fast) – even over slower connections.
Remote Desktop has a few disadvantages though, especially when it comes to the IT help desk:
- You cannot view the remote user’s current desktop
- It’s not cross-platform
- You can’t use RDP if it’s disabled or misconfigured
Especially when troubleshooting user problems, being able to see exactly what the user is doing is obviously very beneficial. VNC-based applications are a good alternative since they allow you to view the user’s desktop and subsequently interact with the user. This makes VNC viable for help desk as well as troubleshooting. Nevertheless, VNC-based solutions have their own shortcomings:
- Free variations of VNC usually offer no deployment assistance
- With over 10 variants available, finding the best VNC implementation is a daunting task
- VNC is still deemed as somewhat insecure
- VNC can be slow
We set out to solve these shortcomings by creating a number of scripts around UltraVNC that integrate with the EventSentry management console (although they’ll work well without EventSentry as well!). Using the QuickTools feature, you can then connect to a remote host via VNC with 2 clicks, even if the remote host doesn’t have VNC installed.
Important: The scripts only work in environments where you have administrative access to the remote hosts. The scripts need to copy files to the remote host’s administrative shares and control the remote VNC service.
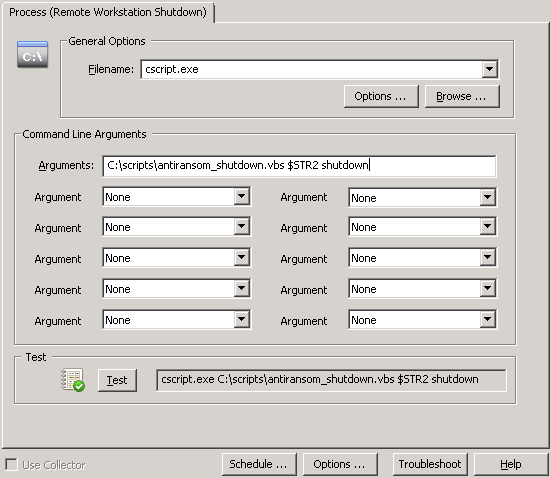
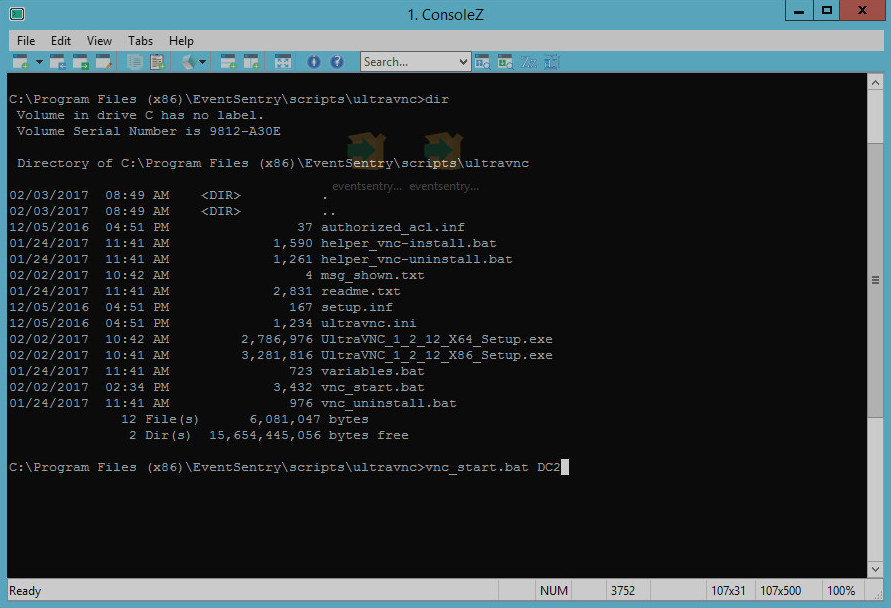
Alternatively, you will also be able to start a VNC session by running the following command:
vnc_start.bat remotehost.yourdomain.com
Even better, VNC can be automatically stopped and deactivated (until vnc_start.bat is run again) once the session is completed in order to reduce the attack surface.
VNC Deployment
As long as you have administrative access to the remote host(s), the script will remotely install VNC and even setup a firewall exclusion rule if necessary – although the UltraVNC installer takes care of this out of the box.
Security
To reduce the attack surface of machines running VNC you can automatically stop the VNC service after you have disconnected from the remote host. Our connection script will automatically start the remote service again when you connect the next time.
For the utmost security you can also completely uninstall VNC when you are done, a script (vnc_uninstall.bat) is included for this purpose.
Speed
Even though VNC is generally not as fast as RDP, it’s usually sufficiently fast in LAN environments (especially for shorter trouble-shooting sessions) and the UltraVNC port which we’ll be covering in this post performs reasonably well even over slower WAN connections.
Integration with EventSentry
Monitoring workstations with EventSentry strengthens the capabilities of any IT helpdesk and IT support team with:
- Software & Hardware Inventory
- Access to process utilization and log consolidation
- Enhanced security with security log & service monitoring
- User console logon tracking
- Pro-active troubleshooting with access to performance and other system health metrics
Remote desktop sharing is an additional benefit with the UltraVNC package which is included with the latest version of EventSentry (v3.3.1.42). Customizing the scripts and integrating them with EventSentry literally shouldn’t take more than 5 minutes, and once setup & configured will allow you to remotely control any monitored host with a couple of clicks. The scripts do not require EventSentry, but are included with the setup and integrate seamlessly into the EventSentry Management Console.
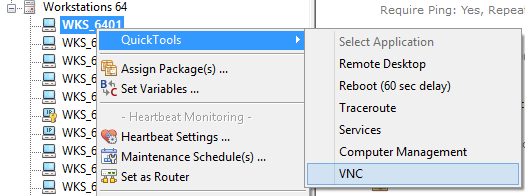
The EventSentry Management Console includes the “QuickTools” feature which allows you to link up to 8 commands to the context menu of a computer item. EventSentry ships with a few default QuickTools commands, for example to reboot a remote machine. Once configured, you simply right-click a computer icon in the EventSentry Management console and select one of the pre-configured applications from the QuickTools sub menu.
How does it work?
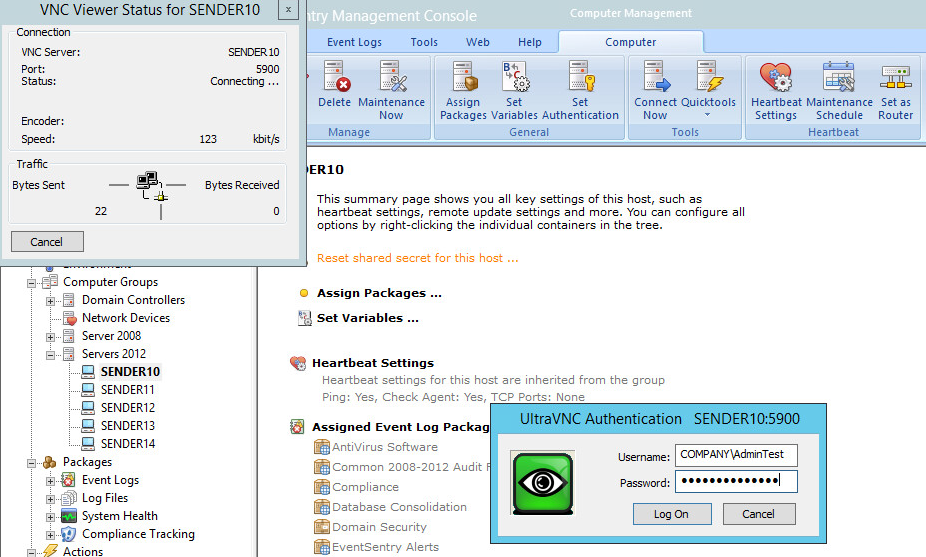
When you run the vnc_start.bat script, it will first check to see if UltraVNC is already installed on the remote host. If it is, it will skip the installation routine and bring up the local VNC viewer. If you configured the script to automatically stop the VNC service when not in use, it will start the service beforehand. When you disconnect, it will (optionally) stop the VNC service again so that VNC is not accessible remotely anymore.
If VNC is not installed, the script will remotely install & configure UltraVNC using psexec.
If you do not want to leave the UltraVNC service installed on the remote computer, the vnc_uninstall.bat script can be run when the remote session is done. Automatically stopping the remote VNC service is however sufficient in most cases.
Prerequisites
There is not much you need:
- psexec.exe from Sysinternals
- Administrative access to the remote hosts
- UltraVNC itself (duh!)
Installation
The scripts need to be configured before they can be used in your environment, unless you are an EventSentry user, in which case you only need to download & install the prerequisites.
Super Quick Setup for EventSentry Users
It’s no secret, we’re a little biased towards our EventSentry users, and as such setting this up with an existing EventSentry installation is rather easy:
- Get psexec.exe and save it in C:\Program Files (x86)\EventSentry\resources.
- Download the UltraVNC installers (they have 32-bit and 64-bit – download for the platforms you have on your network) and store them in the C:\Program Files (x86)\EventSentry\scripts\ultravnc folder.
- Install UltraVNC on the computer where EventSentry is installed so that the VNC Viewer is available. It’s not necessary to install the whole package, only the viewer component is required.
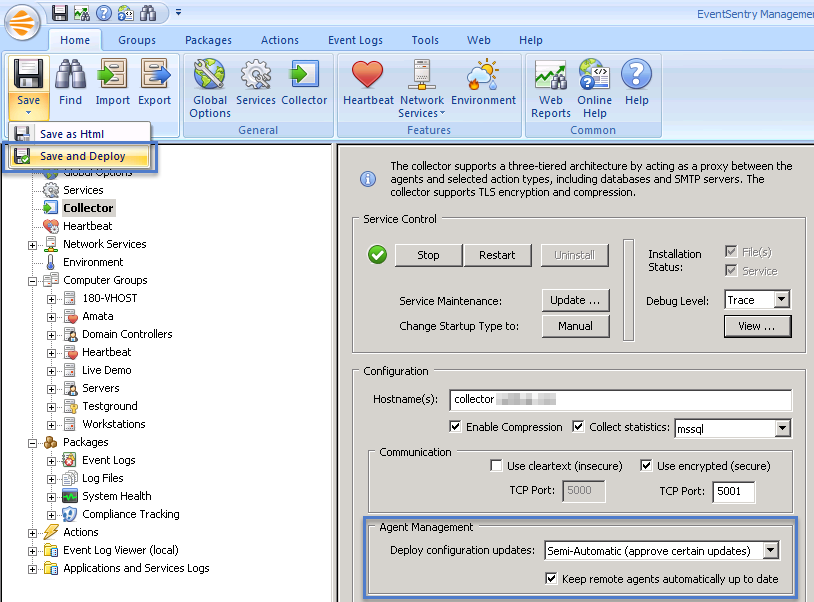
- If “VNC” is not listed in your QuickTools menu, then you will need to add it under Tools->Options->QuickTools. Simply enter “VNC” as the description and specify the path to the vnc_start utility, e.g. “C:\Program Files (x86)\EventSentry\scripts\ultravnc\vnc_start.bat $COMPUTER”. You can optionally check the “Hide” box to prevent the script output from being shown before you connect.
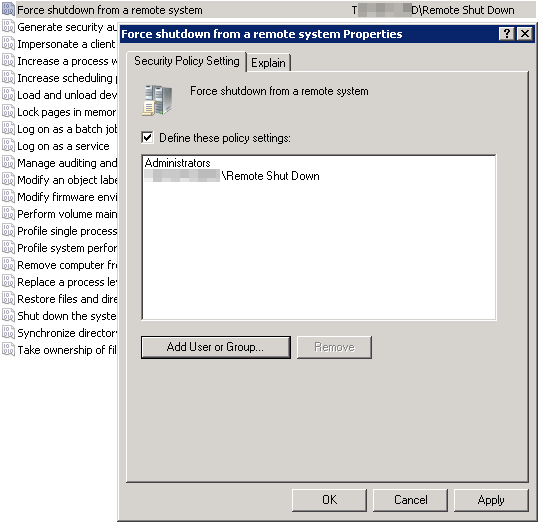
You’ll notice that no password was configured – that’s because you will be logging in with a Windows user and password – only allowing domain admins access by default. This can be configured in the authorized_acl.inf file, if you want to give additional groups and/or users access that are not domain admins.
That’s literally it – easy as pie. Even though we designed this thing to be easy peasy, since things do occasionally go wrong I recommend testing a first connection from the command line. Just open an administrative command prompt, navigate to C:\Program Files (x86)\EventSentry\scripts\ultravnc and type vnc_start somehost.
Now just right-click any host – or use the “Quicktools” button in the ribbon – and select the “VNC” menu option. Keep in mind that first-time connections will take longer since the VNC setup file has to be copied and installed on the remote computer. Subsequent connections should be faster.
Manual Normal-Speed Setup for Non-EventSentry Users
So you are not an EventSentry user but still want to utilize these awesome scripts? No problem – we won’t hold it against you. The setup is still easy – you’ll just need to customize a few variables in the variables.bat file.
- Download the package from here.
- Create a local folder for this project, e.g. C:\Deployment\UltraVNC.
- Copy all the scripts to this folder, e.g. you should end up with C:\Deployment\UltraVNC\vnc_start.bat
- Open the file variables.bat in a text editor and keep it open as you will be making a few modifications to this file.
- In variables.bat, set the VNCSOURCE variable to the directory you just created.
- Download the latest version of both the 32-bit and 64-bit UltraVNC installers.
- In variables.bat, set the VNCSETUP_X86 and VNCSETUP_X64 to the setup file names you just downloaded.
- Download the PSTools and extract psexec.exe into the working directory, or a directory of your choice.
- In variables.bat, point the PSEXECFILE variable to the location where you just saved psexec.exe.
- Optional: Edit the authorized_acl.inf file to specify which Windows group or user will have access to VNC. You can either change the first line, or add additional lines to give additional users and/or groups permission.
- Install the respective version of UltraVNC on your workstation so that the VNC Viewer is available.
- Open a command line window and navigate to the folder to which VNCSOURCE points to. Test the setup by running vnc_start hostname, replacing “hostname” with an actual host name of a remote host of course.
- When presented with the login screen of the VncViewer, log in with a Windows domain admin user.
That wasn’t so bad now, was it? Just remember that you’ll need to initiate any VNC session with the vnc_start.bat file. Just launching the Viewer won’t work – even if VNC is already installed on the remote machine – since the VNC service is stopped by our scripts by default. To use the folder names we created, you’ll just run
C:\Deployment\UltraVNC\vnc_start hostname
Enjoy, and happy RFBing!
Configuration – variables.bat
For the sake of completeness the variables.bat file is explained below:
VNCSETUP_X86: The file name of the 32-bit installer. This needs to only be changed whenever UltraVNC comes out with a new version.
VNCSETUP_X64: The file name of the 64-bit installer. This needs to only be changed whenever UltraVNC comes out with a new version.
REMOTEINSTALLPATH: The directory where the script files will be copied to on the remote host.
VNCSOURCE: This is the folder where all the vnc-related files, including the setup executables, are located on the source host from where you initiate VNC connections – e.g. C:\Deployment\UltraVNC.
VNCINSTALLDIR: The directory in which UltraVNC will be installed in (on the remote hosts).
VNCPASSWORD: This variable is not currently used since UltraVNC is automatically configured to authenticate against Windows, by default giving only Domain Admins access to VNC. This is generally more secure than using a password. You can edit the file authorized_acl.inf to give additional users and/or groups access to VNC. The file supports one ACL entry per line.
PSEXECFILE: Unfortunately we are not allowed to bundle the nifty psexec.exe file for license reasons, so you’ll have to download the PsTools and point this variable to wherever you end up copying the psexec.exe file to. If you already have psexec.exe installed then you can save yourself 2 minutes of time and just specify the path to the existing file here.
SET_VNC_SVC_TO_MANUAL: If you don’t entirely trust the security of VNC, maybe because you know what a brute force attack is, and you only want administrators to access VNC then you can set this variable to 1. As long as you only connect to the remote host(s) using the vnc_install.bat script, the scripts will ensure that the remote VNC service is started before you connect and stopped after you disconnect. Between the two of us, I’d always leave this set to 1 unless you have the desire to launch the VNC Viewer directly, or need non-administrators to be able to connect to the remote host(s).
ADD_FIREWALL_RULE: As the name (almost) implies, this will create a firewall exclusion rule on the remote host(s) if you’ve been doing your homework and enabled the Windows firewall. If you don’t like our boring firewall rule name then you can even change the name below by editing the FW_RULE_NAME variable. Enabling this is usually not necessary since the UltraVNC setup adds firewall exclusion rules by default.
VNCVIEWER: If you find that a different version of the VNC viewer works better than the version which we are shipping, then you can change the file name here.